Get Certified for
Business Intelligence (BIDA®)
Develop analytical superpowers by learning how to use programming and data analytics tools such as VBA, Python, Tableau, Power BI, Power Query, and more.
The analysis, summary, and presentation of findings related to a data set derived from a sample or entire population
The term “descriptive statistics” refers to the analysis, summary, and presentation of findings related to a data set derived from a sample or entire population. Descriptive statistics comprises three main categories – Frequency Distribution, Measures of Central Tendency, and Measures of Variability.
Although descriptive statistics may provide information regarding a data set, they do not allow for conclusions to be made based on the data analysis but rather provide a description of the data being analyzed.
Used for both quantitative and qualitative data, frequency distribution depicts the frequency or count of the different outcomes in a data set or sample. The frequency distribution is normally presented in a table or a graph. Each entry in the table or graph is accompanied by the count or frequency of the values’ occurrences in an interval, range, or specific group.
Frequency distribution is basically a presentation or summary of grouped data categorized based on mutually exclusive classes and the number of occurrences in each respective class. It allows for a more structured and organized way to present raw data.
Common charts and graphs used in frequency distribution presentation and visualization include bar charts, histograms, pie charts, and line charts.
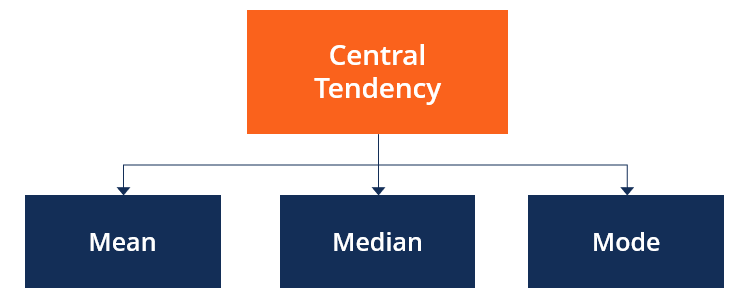
Central tendency refers to a dataset’s descriptive summary using a single value reflecting the center of the data distribution. Measures of central tendency are also known as measures of central location. The mean, median, and mode are the measures of central tendency.
The mean, considered the most popular measure of central tendency, is the average or most common value in a data set. The median refers to the middle score for a data set in ascending order. The mode refers to the score or value that is most frequent in a data set.
A measure of variability is a summary statistic reflecting the degree of dispersion in a sample. The measures of variability determine how far apart the data points appear to fall from the center.
Dispersion, spread, and variability all refer to and denote the range and width of the distribution of values in a data set. The range, standard deviation, and variance are used, respectively, to depict different components and aspects of the spread.
The range depicts the degree of dispersion or an ideal of the distance between the highest and lowest values within a data set. The standard deviation is used to determine the average variance in a set of data and provide an insight into the distance or difference between a value in a data set and the mean value of the same data set. The variance reflects the degree of the spread and is essentially an average of the squared deviations.
For a deeper understanding of different foundational statistics concepts and tools, check out CFI’s Statistics Fundamentals course!
Descriptive statistics allow for the ease of data visualization. It allows for data to be presented in a meaningful and understandable way, which, in turn, allows for a simplified interpretation of the data set in question. Raw data would be difficult to analyze, and trend and pattern determination may be challenging to perform. In addition, raw data makes it challenging to visualize what the data is showing.
Consider the following example:
There are 100 students enrolled for a particular module. To find the overall performance of the students taking the respective module and the distribution of the marks, descriptive statistics must be used. Getting the marks as raw data would prove the determination of the overall performance and the distribution of the marks to be challenging.
Furthermore, descriptive statistics allow for a data set to be summarized and presented through a combination of tabulated and graphical descriptions and a discussion of the results found. Descriptive statistics are used to summarize complex quantitative data.
Connect what you just learned to a clear career path with CFI’s role‑based courses and certification programs.
Thank you for reading CFI’s guide to Descriptive Statistics. To keep advancing your career, the additional resources below will be useful:


