Get Certified for
Business Intelligence (BIDA®)
Develop analytical superpowers by learning how to use programming and data analytics tools such as VBA, Python, Tableau, Power BI, Power Query, and more.
A descriptive summary of a dataset through a single value that reflects the center of the data distribution
Central tendency is a descriptive summary of a dataset through a single value that reflects the center of the data distribution. Along with the variability (dispersion) of a dataset, central tendency is a branch of descriptive statistics.
The central tendency is one of the most quintessential concepts in statistics. Although it does not provide information regarding the individual values in the dataset, it delivers a comprehensive summary of the whole dataset.
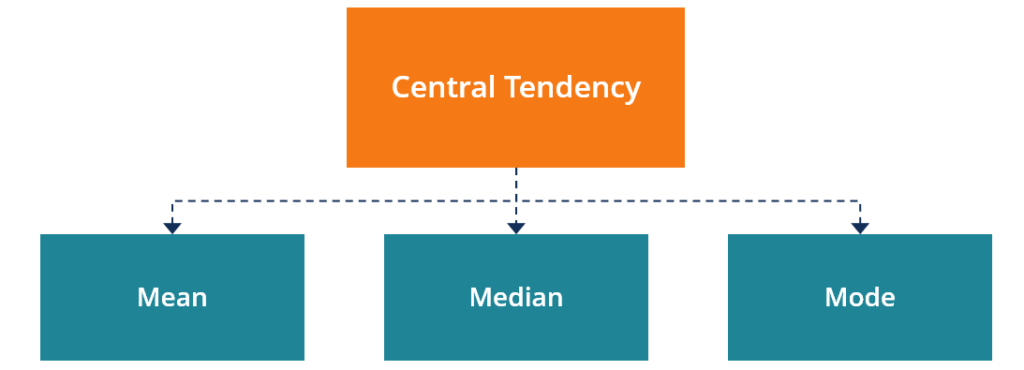
Generally, the central tendency of a dataset can be described using the following measures:
Even though the measures above are the most commonly used to define central tendency, there are some other measures, including, but not limited to, geometric mean, harmonic mean, midrange, and geometric median.
The selection of a central tendency measure depends on the properties of a dataset. For instance, the mode is the only central tendency measure for categorical data, while a median works best with ordinal data.
Although the mean is regarded as the best measure of central tendency for quantitative data, that is not always the case. For example, the mean may not work well with quantitative datasets that contain extremely large or extremely small values. The extreme values may distort the mean. Thus, you may consider other measures.
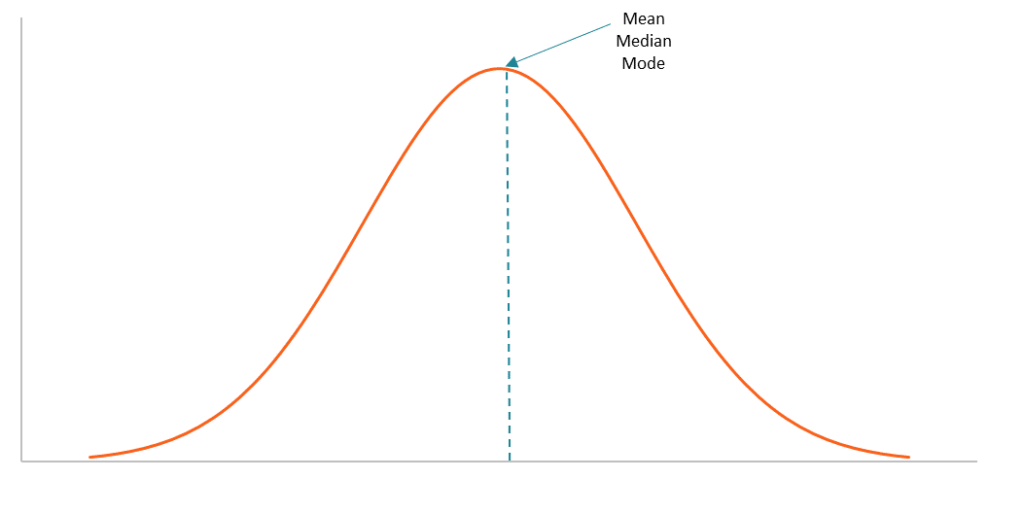
The measures of central tendency can be found using a formula or definition. Also, they can be identified using a frequency distribution graph. Note that for datasets that follow a normal distribution, the mean, median, and mode are located on the same spot on the graph.
Thank you for reading CFI’s guide on Central Tendency. To keep learning and advancing your career, the following resources will be helpful:


