Get Certified for
Capital Markets (CMSA®)
From equities and fixed income to derivatives, the CMSA certification bridges the gap from where you are now to where you want to be — a world-class capital markets analyst.
A technical indicator used to identify support and resistance levels in a time series of prices or index levels
A Fibonacci retracement is a technical indicator used to identify support and resistance levels in a time series of prices or index levels. Unlike many technical indicators, Fibonacci retracements cannot be used directly to generate buy and sell signals. Instead, they are used as guides in conjunction with other indicators to make trading decisions.
Why are Fibonacci retracements named as such? The indicator derives its name from the well-known mathematical sequence called the Fibonacci sequence. It is a simple sequence that can be generated from two basic rules:
The following formula summarizes the sequence:
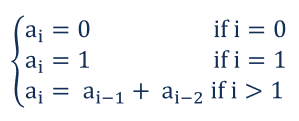
Using the formula, we get the following sequence:
![]()
A special property of the Fibonacci numbers is that certain ratios of its elements remain constant. They are the ratios of an element an to its preceding elements an-1, an-2, and an-3. The ratios are illustrated in the chart below.
The horizontal axis is n, and the vertical axis is the ratio. As is clear from the chart, the ratios bounce around for small n, but for n greater than 5, the ratios stabilize.

The ratios form the support or resistance levels in Fibonacci Retracement analysis. The important levels are 61.8% (an-1 / an), 38.2% (an-2 / an), and 23.6% (an-3 / an). There are other important levels like 78.6% and 50%, which are not Fibonacci ratios but are nonetheless important. The 78.6% level is given by the square root of 61.8%, while the 50% level is a common convention.
There are also higher levels that are given by the reciprocals of the aforementioned ratios, e.g., 1.618 (an / an-1).
To begin the Fibonacci Retracement Analysis, find a strong upward or downward trend in the stock price. The study range for the analysis are the high and low points of the trend being studied. Fibonacci retracements levels are calculated based on the two points.
To create Fibonacci retracement in a downtrend, pick the high price and low price. The pair defines the range from which the Fibonacci levels will be calculated. The levels from the downtrend can be computed using the following simple formula:
![]()
The Fibonacci level refers to the levels derived above, e.g., 38.2%, 61.8%, 23.6%, etc. Once calculated, the levels are overlaid on the price chart to gain intuition about the future support or resistance level.
Let’s apply the formula to a real price series. We begin with the daily historical price series of Wajax Corporation (WJX.TO) – a construction company based in Mississauga, Ontario. The price history spans the year 2020, but we choose the period from January to March 2020. This period saw a sharp downward trend in the price.
For the study range, we choose the high price of $14.87 per share and a low of $5.70 per share. It yields the Fibonacci Price Levels of $9.20 (38.2% level), $10.20 (50% level), and $12.40 (61.8% level). The levels can be seen in the chart below. Now, we track the price over the next few months.
As is evident from the chart, the price doesn’t break the 38.2% resistance level for three months. It finally does break the 38.2% level and crosses the 50% level to the price of about $11.70 per share. However, it soon hits the 61.8% resistance level, which it does not cross for the rest of the study period.
The takeaway from the above analysis is that a trader can use the Fibonacci levels as alert levels while making a trading decision. For example, if the price approaches certain resistance levels, the trader can decide to place a sell order to maximize the profits.
To create Fibonacci retracement levels for an upward trend, pick the high and low price levels. The levels will be used to calculate the Fibonacci Price levels. The following formula can be used to calculate the price levels for an uptrend:
![]()
The Fibonacci levels used are the same as the downtrend calculations, viz. 38.2%, 50%, 61.8%, and 78.6%.
Let’s apply the above analysis to real stock prices. We again choose Wajax Corp. (WJX.TO), but here, we choose a different date range starting June 2020 to December 2020. During the period, the price rallied from $8.50 per share to $18.40 per share. It yields the price levels of $14.4 0(38.2% level), $13.30 (50% level), and $12.17 (61.8% level).
Looking at the chart below, it is clear that the Fibonacci retracement levels form strong support levels for the price. In such a case, the 61.8% levels prove a strong support level, which once crossed holds for the rest of the study period.
The key takeaway is that in an uptrend, a trader can use the Fibonacci levels to place buy orders when a certain resistance level is reached. The implied bet being that the price will be at its lowest level given the trend and will likely bounce back.

To keep advancing your career, the additional resources below will be useful:


