Net Change
The difference between the closing price of a prior trading period and the closing price of the current trading period for a financial security
What is Net Change?
Net change is the difference between the closing price of a prior trading period and the closing price of the current trading period for a financial security. Net change is generally used for stock prices, bond prices, mutual funds, derivative products, and other tradeable securities. The net change usually refers to the daily change in price.
Net change represents the most common data represented for financial quotes. All trading platforms and real-time market data providers show net change when quoting prices. Net change is also an important information source for technical analysis.
Practical Example
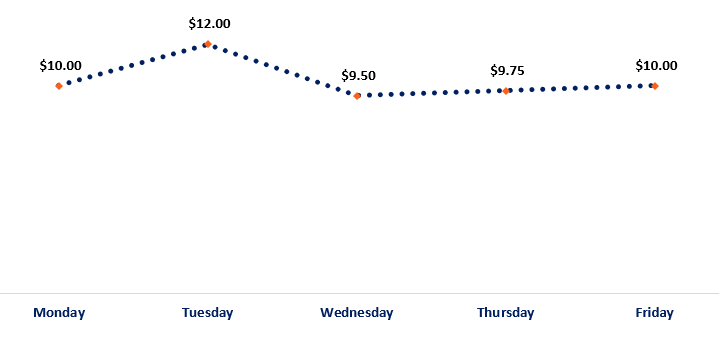
The closing price of a stock on day one (Monday) is $10.00. On day two (Tuesday), the stock closes at $12.00; on day three (Wednesday), the stock closes at $9.50; on day four (Thursday), the stock closes at $9.75; and on day five (Friday), the stock closes at $10.00.
What is the daily and weekly net change of the stock?
The net change on day two is +$2.00 ($12.00 – $10.00)
The net change on day three is -$2.50 ($9.50 – $12.00)
The net change on day four is +$0.25 ($9.75 – $9.50)
The net change on day five is +$0.25 ($10.00 – $9.75)
However, the net change over the week is $0.00 ($10.00 – $10.00) since a trading week is only five days.
Understanding Net Change
The net change can be the difference in price from any trading period, no matter the length, for various financial assets. Some examples of financial assets include:
- Stocks
- Bonds
- ETFs
- Commodity contracts
- Mutual funds
- Futures
- Options
One thing to note is that all the financial assets trade in an active market or exchange. It allows for liquidity and price efficiency so that the net change can be accurately reflected. If there is no active market, it would be almost impossible to track the net change of prices.
Price Efficiency
Price efficiency is the concept that a market price reflects all the market conditions of supply and demand. Therefore, the price is an equilibrium containing all known information. It is an important underlying concept of financial markets, and what allows market participants to trust and trade assets with complete strangers.
How to Express Net Change
The difference between prices from different time periods is reported as the net change, but it can also be referred to as simply “change.” When an asset’s gained value, the positive net change is expressed with a plus sign, +0.50, which may represent 50 cents or any other denominated currency. If an asset’s lost value, the negative net change is expressed with a negative sign, -0.50.
The difference can also be expressed as a percentage amount. In fact, a percentage amount is more useful because it shows the relative return that is not captured by the absolute price change. It makes comparing net changes between assets easier.
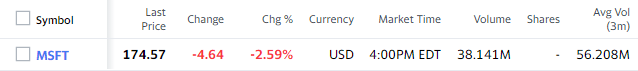
An electronic quote, which is the most efficient and up-to-date to receive market information, will often retrieve information from multiple exchanges.
For stocks, the quotes will show the company name, ticker symbol, price, volume, high, low, close, and net change.
Use of Net Change in Technical Analysis
Net change is very important in technical analysis. Technical analysis is a trading philosophy and strategy that is utilized to evaluate and identify trading opportunities based on historical statistical data gathered from trading history. It refers to attempting to evaluate a security based on its historical price movements and volume trends. It is in contrast to fundamental analysis, which is focused on evaluating securities based on the underlying business results, such as earnings.
As mentioned, technical analysis makes use of the price history of assets in order to evaluate securities. Therefore, the net change in price is very important within the discipline. Net change is often represented in various stock charts. Some examples are:
- Line chart
- Bar chart
- OHLC (open-high-low-close) chart
- Candlestick chart
- Mountain chart
- Point-and-figure chart
Technical analysis traders utilize the charts to identify trends in prices and volume. By analyzing the historical trends, the traders will forecast where the directional patterns will lead to in the future.
Net change represented in charts allows such traders to identify patterns during periods of time that they believe will eventually lead to a certain price target.
Related Readings
CFI offers the Commercial Banking & Credit Analyst (CBCA)™ certification program for those looking to take their careers to the next level. To keep learning and advancing your career, the following resources will be helpful:


