Head and Shoulders Pattern – Technical Analysis
A forecast chart formation that usually indicates a reversal in stock market trends
Over 1.8 million professionals use CFI to learn accounting, financial analysis, modeling and more. Start with a free account to explore 20+ always-free courses and hundreds of finance templates and cheat sheets.
Head and Shoulders
Traders and analysts constantly study trends and patterns when watching the market in hopes of detecting the next most probable price movement. Spotting and correctly identifying patterns, and understanding their significance, is vital to successful trading.
The head and shoulders pattern is important because of its longstanding history of reliability among market analysts. Below, we’ll discuss this pattern in detail, explaining its significance and how you can profit from using it.
The Basics of the Head and Shoulders Pattern
In terms of technical analysis, the head and shoulders pattern is a predicting chart formation that usually indicates a reversal in the trend where the market makes a shift from bullish to bearish, or vice-versa. This pattern has long been hailed as a reliable pattern that predicts trend reversal.
Before we continue, it’s important to keep in mind that the head and shoulders pattern is almost never perfect, meaning, there will likely be small price fluctuations in between the shoulders and the head, and the pattern formation is rarely perfectly shaped in its appearance.
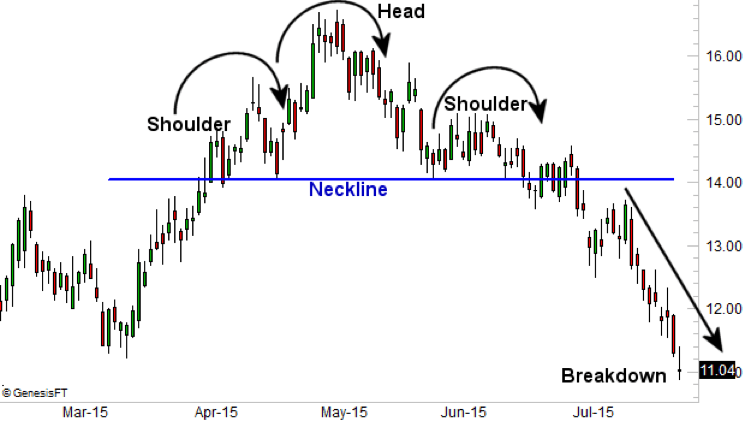
There are three main components to the head and shoulders pattern. Before we explain each part, take a look at the picture below.

This picture is a clear representation of the three parts of this pattern–two shoulder areas and a head area that the price moves through in creating the pattern signaling a market reversal. The first “shoulder” forms after a significant bullish period in the market when the price rises and then declines into a trough. The “head” is then formed when the price increases again, creating a high peak above the level of the first shoulder formation.
From this point, the price falls and creates the second shoulder, which is usually similar in appearance to the first shoulder. Importantly, the initial decline does not carry significantly below the level of the first shoulder before there is usually either a slight retracement upward or a flattening out of price movement.
The pattern is completed, giving a market reversal signal, when the price declines again, breaking below the neckline. The neckline, as depicted above, is the horizontal line that connects the first two troughs to one another.
The Head and Shoulders Inverse Pattern
Head and shoulders patterns can also form in the opposite direction, signaling a market reversal and trend change from bearish to bullish. This is commonly known as an inverse head and shoulders pattern and, simply put, it is essentially the exact opposite of the pattern we just described – or in other words, an upside-down head and shoulders pattern. The inverse pattern is, therefore, a signal that the market is transitioning from a downward trend into an upward trend.
With the inverse head and shoulders pattern, stock prices will dip into three lows that are separated by two temporary periods of price rallying. The middle trough, which would be the head of the inverse pattern, is the lowest, while the shoulders are somewhat less deep. Once the second shoulder has formed, prices will make a final rally, breaking above the neckline and indicating the bearish trend has reversed and that bulls are likely taking control of the market.
Interpreting the Pattern
The head and shoulders pattern is favored among traders because of its unique ability to help them determine price target estimates once the pattern has completed itself and the neckline has finally been crossed. It also makes it easy for traders to place stop-loss orders. In the case of a peaking head and shoulders pattern, stops are typically placed above the top-of-the-head high price. With an inverse head and shoulders pattern, stops are usually placed below the low price formed by the head pattern.
In order to estimate how much prices will move after the neckline is broken, you need to return to the pattern and measure the distance, vertically, from the top of the head to the neckline. Then, simply subtract that same distance from the neckline in the opposite direction, starting in the spot where prices first crossed the neckline after the pattern has formed its second shoulder. For example, if the distance between the neckline and the top of the head represents $20 in the price of a stock, then once the neckline is broken, analysts would project the stock to decline in price at least another $20 below the neckline price level. This is just an estimate, however, many traders trust the number and move forward with the belief that prices are likely to decline at least that much.
When dealing with a traditional head and shoulders pattern, you’d be measuring the vertical distance from the top of the head down to the neckline, enabling you to determine an estimated spread amount as we just discussed. Of course, when dealing with an inverse pattern, the opposite is true. Measure the vertical distance from the top of the head up to the neckline, giving you a rough idea of how far prices are likely to move up past the neckline.
Using the Pattern to Trade
Before making any trades, it’s important to let a head and shoulders pattern complete itself. If the pattern seems to be forming, or is in the middle of forming, you shouldn’t assume that it will fully develop and make trades based on what you believe is going to happen. The market can be fickle and changes at the drop of a hat, so remember to watch trends as they develop and be patient. Try to avoid getting caught over-anticipating.
Plan your trades ahead of time so you’ll be ready to move forward once the neckline is broken. Watch for variables that might make it necessary to change your entries, stops, and profit targets.
There is an alternate entry point that traders often pick, however, it requires due diligence, patience, and quick action at the right time. Traders taking this alternate approach watch the pattern and – after the neckline is broken – wait for prices to retrace upward to, or to slightly above, the neckline level. This is a more conservative trade that often allows a trader the opportunity to enter at a more favorable price. However, there’s the possibility that you might be waiting for a retracement that never develops and thus miss the trading opportunity altogether.
The Bottom Line
At the end of the day, it’s important to stick with trades that respect your risk tolerance and help you achieve your trading goals. The head and shoulders pattern has been historically shown to be a fairly reliable one in a space that is characteristically unpredictable. It’s also one of the most easily recognizable chart patterns. No chart pattern is an accurate predictor 100% of the time, but when the head and shoulders pattern correctly signals a major trend change, it represents a correspondingly major profit opportunity.
Learn more:
Thank you for reading CFI’s guide on Head and Shoulders Pattern – Technical Analysis. To keep learning and advancing your career, the following resources will be helpful:
Create a free account to unlock this Template
Access and download collection of free Templates to help power your productivity and performance.
Already have an account? Log in
Supercharge your skills with Premium Templates
Take your learning and productivity to the next level with our Premium Templates.
Upgrading to a paid membership gives you access to our extensive collection of plug-and-play Templates designed to power your performance—as well as CFI's full course catalog and accredited Certification Programs.
Already have a Self-Study or Full-Immersion membership? Log in
Access Exclusive Templates
Gain unlimited access to more than 250 productivity Templates, CFI's full course catalog and accredited Certification Programs, hundreds of resources, expert reviews and support, the chance to work with real-world finance and research tools, and more.
Already have a Full-Immersion membership? Log in


