Get Certified for
Capital Markets (CMSA®)
From equities and fixed income to derivatives, the CMSA certification bridges the gap from where you are now to where you want to be — a world-class capital markets analyst.
Period of time required to recoup the cost of investment
The Payback Period shows how long it takes for a business to recoup an investment. This type of analysis allows firms to compare alternative investment opportunities and decide on a project that returns its investment in the shortest time if that criteria is important to them.
For example, a firm may decide to invest in an asset with an initial cost of $1 million. Over the next five years, the firm receives positive cash flows that diminish over time. What is the payback period? As seen from the graph below, the initial investment is fully offset by positive cash flows somewhere between periods 2 and 3.
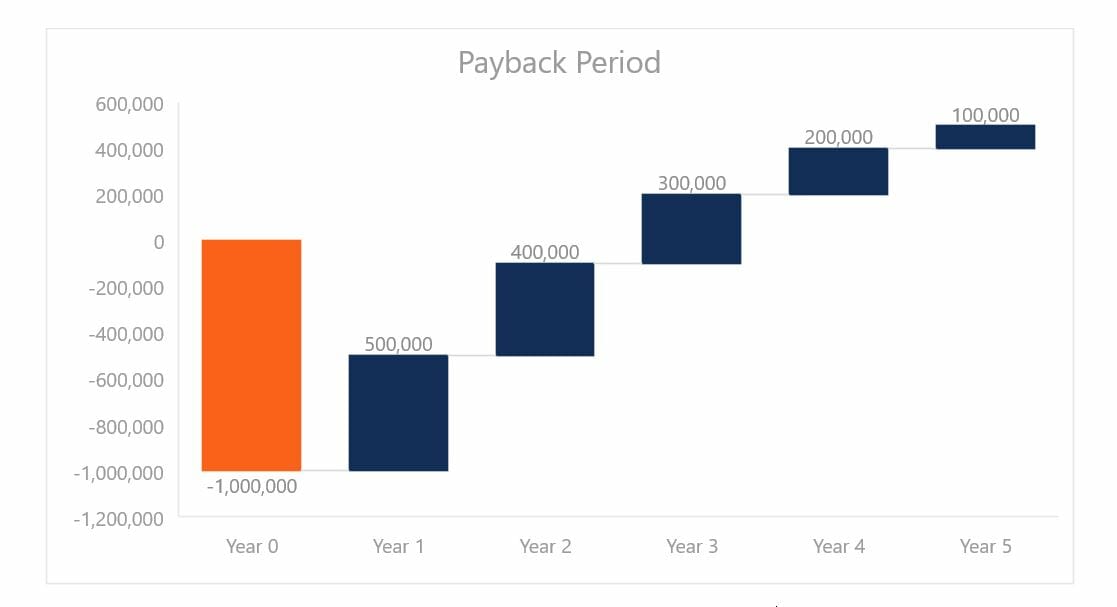
To find exactly when payback occurs, the following formula can be used:

Applying the formula to the example, we take the initial investment at its absolute value. The opening and closing period cumulative cash flows are $900,000 and $1,200,000, respectively. This is because, as we noted, the initial investment is recouped somewhere between periods 2 and 3. Applying the formula provides the following:
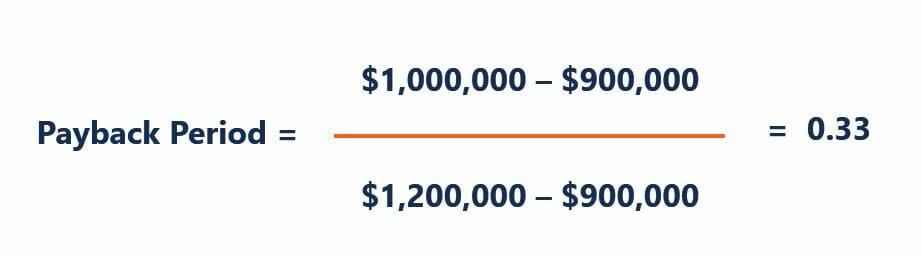
As such, the payback period for this project is 2.33 years. The decision rule using the payback period is to minimize the time taken for the return on investment.
* By submitting your email address, you consent to receive email messages (including discounts and newsletters) regarding Corporate Finance Institute and its products and services and other matters (including the products and services of Corporate Finance Institute's affiliates and other organizations). You may withdraw your consent at any time.
This request for consent is made by Corporate Finance Institute, #1392 - 1771 Robson Street, Vancouver, BC V6G 3B7, Canada. www.corporatefinanceinstitute.com. [email protected]. Please click here to view CFI`s privacy policy.
In essence, the payback period is used very similarly to a Breakeven Analysis, but instead of the number of units to cover fixed costs, it considers the amount of time required to return an investment.
Given its nature, the payback period is often used as an initial analysis that can be understood without much technical knowledge. It is easy to calculate and is often referred to as the “back of the envelope” calculation. Also, it is a simple measure of risk, as it shows how quickly money can be returned from an investment. However, there are additional considerations that should be taken into account when performing the capital budgeting process.
While the payback period shows us how long it takes for the return on investment, it does not show what the return on investment is. Referring to our example, cash flows continue beyond period 3, but they are not relevant in accordance with the decision rule in the payback method.
Building on the previous example, the firm may have a second option of investing in another project that offers the following cash flows:

The other project would have a payback period of 4.25 years but would generate higher returns on investment than the first project. However, based solely on the payback period, the firm would select the first project over this alternative. The implications of this are that firms may choose investments with shorter payback periods at the expense of profitability.
Another issue with the payback period is that it does not explicitly discount for the risk and opportunity costs associated with the project. In some ways, a shorter payback period suggests lower risk exposure since the investment is returned at an earlier date. However, different projects may have exposure to different levels of risk even during the same period. Project risk is often determined by estimating WACC.
As an alternative to looking at how quickly an investment is paid back, and given the drawback outline above, it may be better for firms to look at the internal rate of return (IRR) when comparing projects.
Financial analysts will perform financial modeling and IRR analysis to compare the attractiveness of different projects. By forecasting free cash flows into the future, it is then possible to use the XIRR function in Excel to determine what discount rate sets the Net Present Value of the project to zero (the definition of IRR).
Since IRR does not take risk into account, it should be looked at in conjunction with the payback period to determine which project is most attractive.
As you can see in the example below, a DCF model is used to graph the payback period (middle graph below).
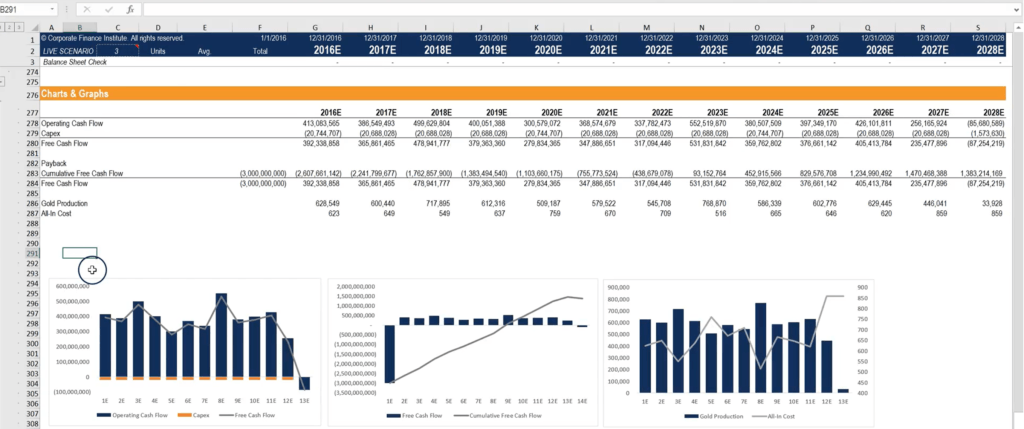
Source: CFI Financial Modeling Courses online.
Thank you for reading CFI’s guide to Payback Period. To continue learning and developing your skills, these additional free CFI resources will be helpful:
Below is a break down of subject weightings in the FMVA® financial analyst program. As you can see there is a heavy focus on financial modeling, finance, Excel, business valuation, budgeting/forecasting, PowerPoint presentations, accounting and business strategy.

A well rounded financial analyst possesses all of the above skills!
CFI is the global institution behind the financial modeling and valuation analyst FMVA® Designation. CFI is on a mission to enable anyone to be a great financial analyst and have a great career path. In order to help you advance your career, CFI has compiled many resources to assist you along the path.
In order to become a great financial analyst, here are some more questions and answers for you to discover:


