Get Certified for Financial Modeling (FMVA)®
Gain in-demand industry knowledge and hands-on practice that will help you stand out from the competition and become a world-class financial analyst.
A mode of analyzing time-series data
YoY stands for Year over Year and is a type of financial analysis that’s useful when comparing time series data. Analysts are able to deduce changes in the quantity or quality of certain business aspects with YoY analysis. In finance, investors usually compare the performance of financial instruments on a year-over-year basis to gauge whether or not an instrument is performing expected. This analysis is also very useful when analyzing growth patterns and trends.
Economic analysts also commonly use this approach when analyzing countries and their overall economic situation. For example, the YoY approach finds that Japanese GDP grew 2% in 2016 as compared to 2015, while analysts previously only projected an increase of 1.8%
The YoY approach may also be useful in analyzing monthly revenue growth, especially when the sources of revenue are cyclical. This allows an apples-to-apples comparison of revenue instead of comparing revenue month-over-month where there may be large seasonal changes.
For example, in the relatively seasonal chocolate industry, it would be more useful to compare revenue growth between December 2016 and December 2017 (where sales are high due to winter sales), as opposed to comparing March 2016 to February 2016, where holiday sales have started to slow. By comparing months in a year-over-year fashion, the comparison becomes more relevant than two consecutive months that are affected by varying seasonality or other factors.
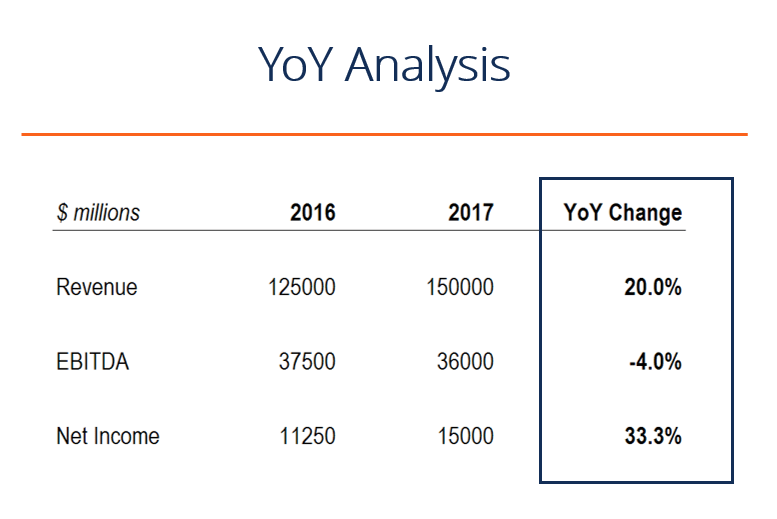
Here is a list of the most commonly used financial metrics for conducting a year-over-year comparison:
Here is a list of the most commonly used metrics for conducting a year-over-year comparison:
As an alternative to YoY analysis, an analyst may also want to look at other time-series data such as:
Click the button below to download CFI’s free Year-over-Year Analysis template!
Here is a detailed example of YoY analysis in action. This example comes from a financial modeling exercise where an analyst is comparing the number of units sold in Q3 2018 to the number of units sold in Q3 2017.
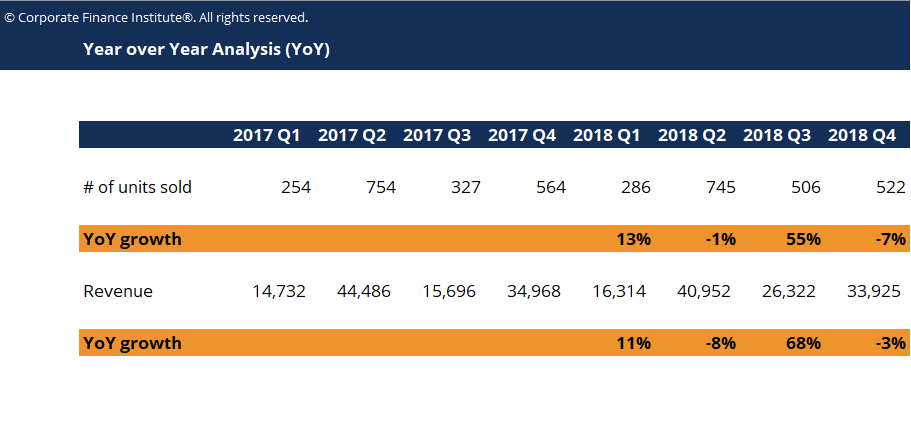
Let’s break down the YoY analysis step by step.
There were 506 units sold in Q3 2018 and 327 units sold in Q3 2017. To compare the two, we take 506 and divide it by 327, then subtract one. The result shows a 55% increase in units sold on a year-over-year basis between Q3-2018 and Q3-2017.
Connect what you just learned to a clear career path with CFI’s role‑based courses and certification programs.
Thank you for reading CFI’s guide to YoY (Year over Year). To keep learning and advance your career, the following resources will be helpful:


