Get Certified for Financial Modeling (FMVA)®
Gain in-demand industry knowledge and hands-on practice that will help you stand out from the competition and become a world-class financial analyst.
The rate of change between quarterly fiscal data
Quarter on quarter (QOQ) is the rate of change between quarterly fiscal data. It is a commonly used metric in determining a company’s quarterly growth or, alternatively, used broadly to evaluate macroeconomic performance (such as GDP). QOQ is used synonymously with quarter over quarter (Q/Q).

Quarter on quarter is a popular measurement largely because important public company reports are often issued quarterly – such as the SEC Form 10-Q. QOQ can be used by businesses to track their performance relative to their goals.
Furthermore, such measurement on historical data allows investors and policymakers to readjust their decisions and gain a perspective of future performance. By calculating change, it also allows investors to compare across different investments of various sizes.
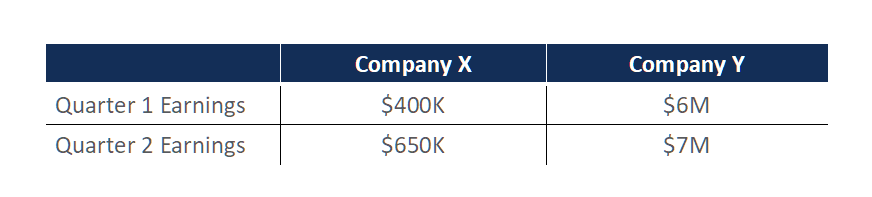
Consider the scenario above comparing quarterly returns between two companies. Company X is a newly founded small-cap company, while Company Y is a mature large-cap company. Due to the large differences between the two companies, it would be impractical to directly compare total earnings.
An appropriate approach to comparing the two companies is by calculating the quarter-on-quarter earnings growth. Company X’s QOQ earnings growth is (650-400)/400 = 0.625 or 62.5%. Company Y’s QOQ earnings growth is (7-6)/6 = 0.167 or 16.7%.
From the QOQ figures, we can gather that Company X experienced spectacular growth, and as an investor, we may be more inclined to invest in Company X (with the consideration of other metrics as well).

Quarter on quarter is often observed over several quarters to determine longer trends. In the chart above, QOQ results are plotted for the Royal Bank of Canada (RBC) and Toronto Dominion (TD) over four quarters of 2020.
As observed, both companies suffer a sharp decline in earnings between Q1-Q2. From Q2-Q3, both companies experienced positive growth, with RBC’s growth more than doubled TD’s. In the last segment from Q3-Q4, RBC experienced minimal earnings growth while TD accomplished an impressive upsurge.
One caveat is that the quarters of the comparables must be around the same start date to be accurate. Otherwise, our results can be skewed by seasonality or specific events.
For example, if we compare the QOQ of RBC from Q3 2019 – Q4 2019 and TD from Q4 2019 – Q1 2020, our results would be very distorted because TD’s data would be negatively impacted by the COVID-19 pandemic in early 2020.
The other two widely used time frames are monthly and yearly. Among the major economic indicators are Consumer Price Index (CPI) and inflation, which are reported on a monthly basis. Perhaps, the most important report for investors is the SEC Form 10-K – a comprehensive audited report that is released annually. For such information, metrics such as month-over-month (MOM) and year-over-year (YOY) would be applicable.
There are a few subtle differences between the time frames. Shorter time frames, such as monthly, are valuable for analyzing data that are driven by short-term factors. Short-term data and metrics will also be more volatile. Longer time frames like yearly are best suited for data-driven by long-term factors. Long-term metrics are less susceptible to fluctuations because it smooths out short-term deviations.
For example, conducting YOY over two years would be similar to conducting QOQ over eight quarters or MOM over 24 months. Longer time frames provide a holistic overview of performance, while shorter time frames demonstrate a better representation of the effects of events and seasonality.
Connect what you just learned to a clear career path with CFI’s role‑based courses and certification programs.
CFI offers the Financial Modeling & Valuation Analyst (FMVA®) certification program for those looking to take their careers to the next level. To keep learning and advance your career, the following resources will be helpful:


