Overview
AI-Powered Dashboards & Executive Reporting
A dashboard turns data into visuals that make it easier for others to interpret results and make better informed decisions. AI can build one in minutes, but it cannot tell you whether the numbers on it are right. In this course, you will use AI to build the same interactive dashboard in HTML and in Excel from a clean dataset, and compare what free and paid AI tools produce from a single prompt. You will learn to check AI-built dashboards for errors that never show an error message, and to refresh both dashboards with new data without rebuilding them. Finally, you will use a reusable AI skill to turn the same portfolio into a hypothetical target-date fund recommendation, delivered as a Word memo and an interactive HTML report, and see why a person still reviews it.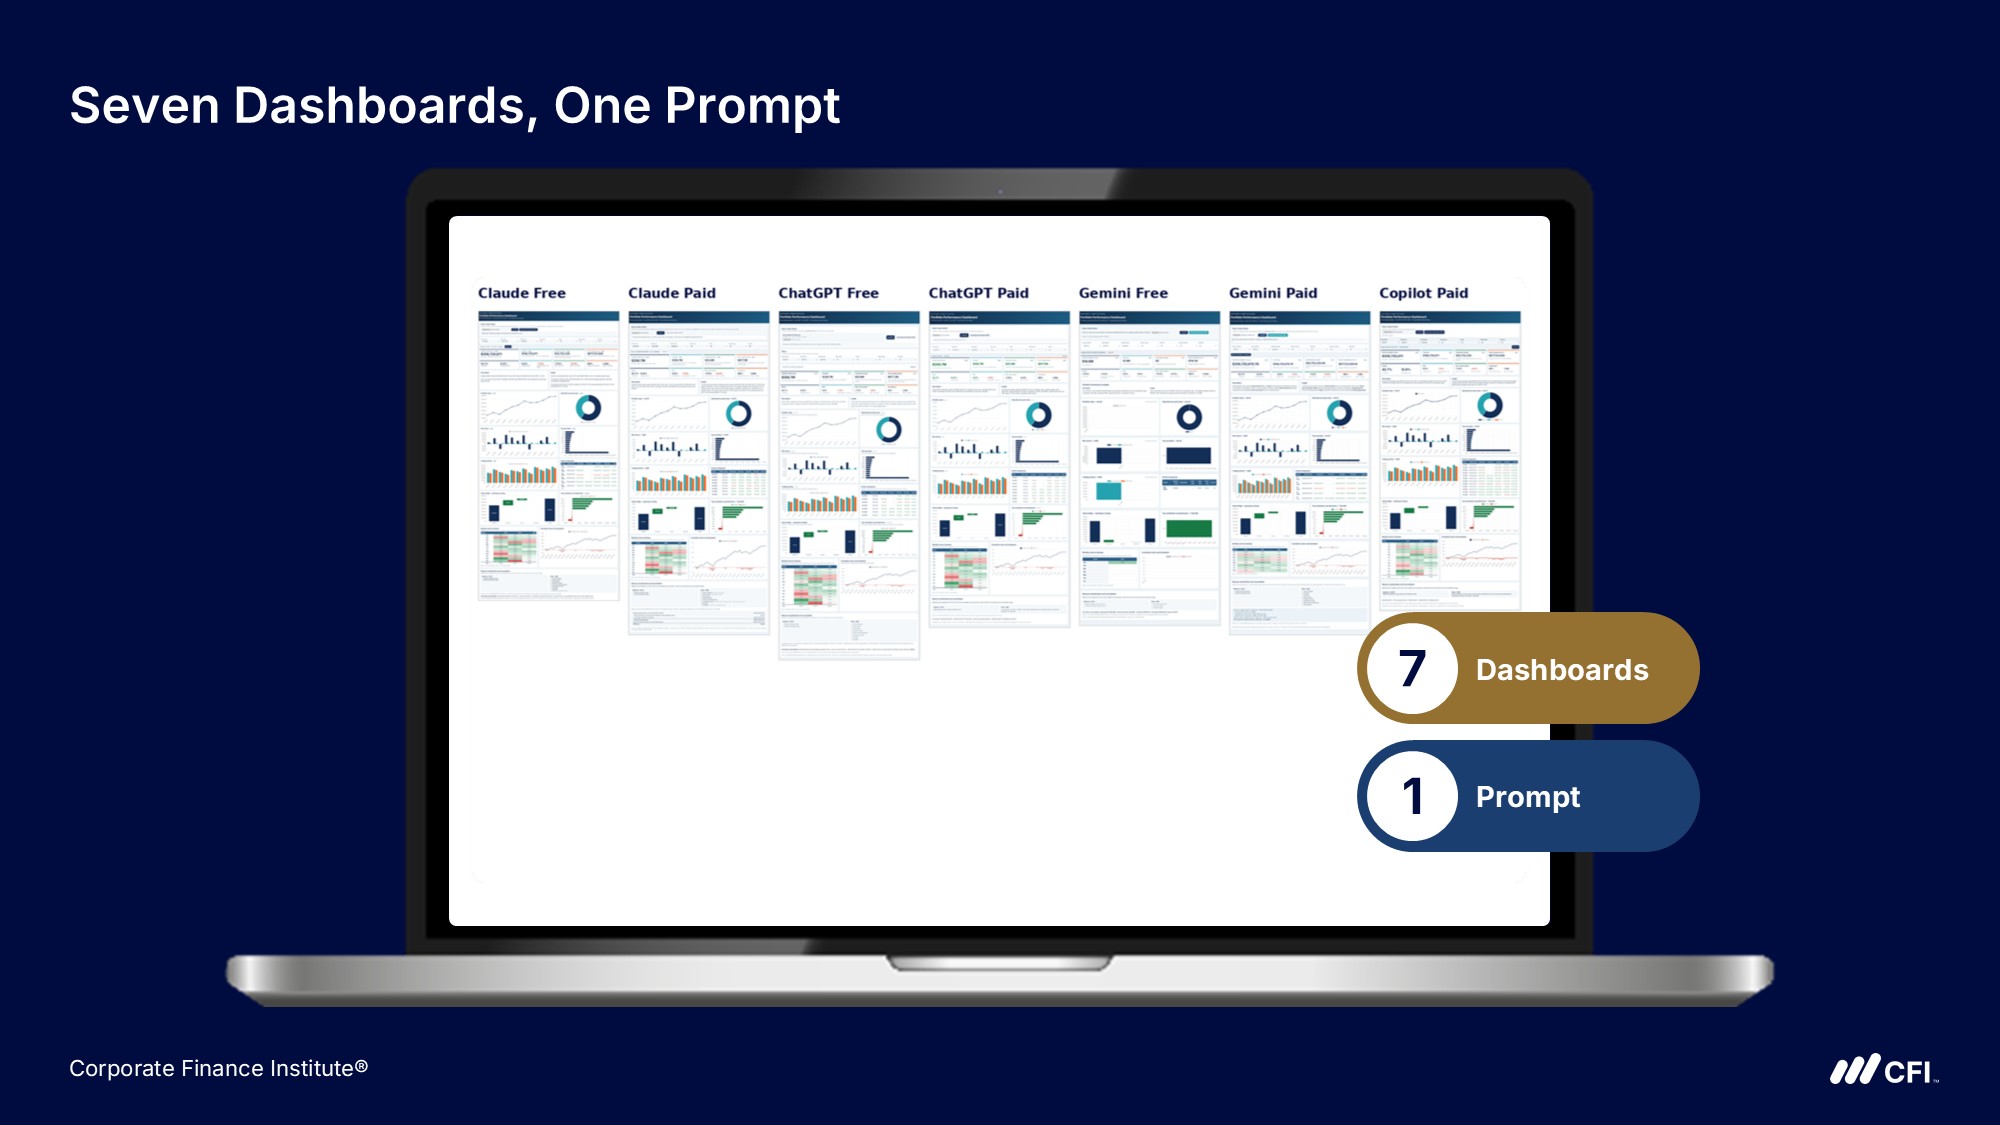
Who should take this course?
This course is designed for analysts, associates and managers in FP&A, equity research, credit analysis, investment banking and portfolio roles who produce recurring reporting that management acts on, and who want to use AI to build it faster without losing control of the numbers. It also suits reviewers who need to know what to check before they sign off an AI-built dashboard.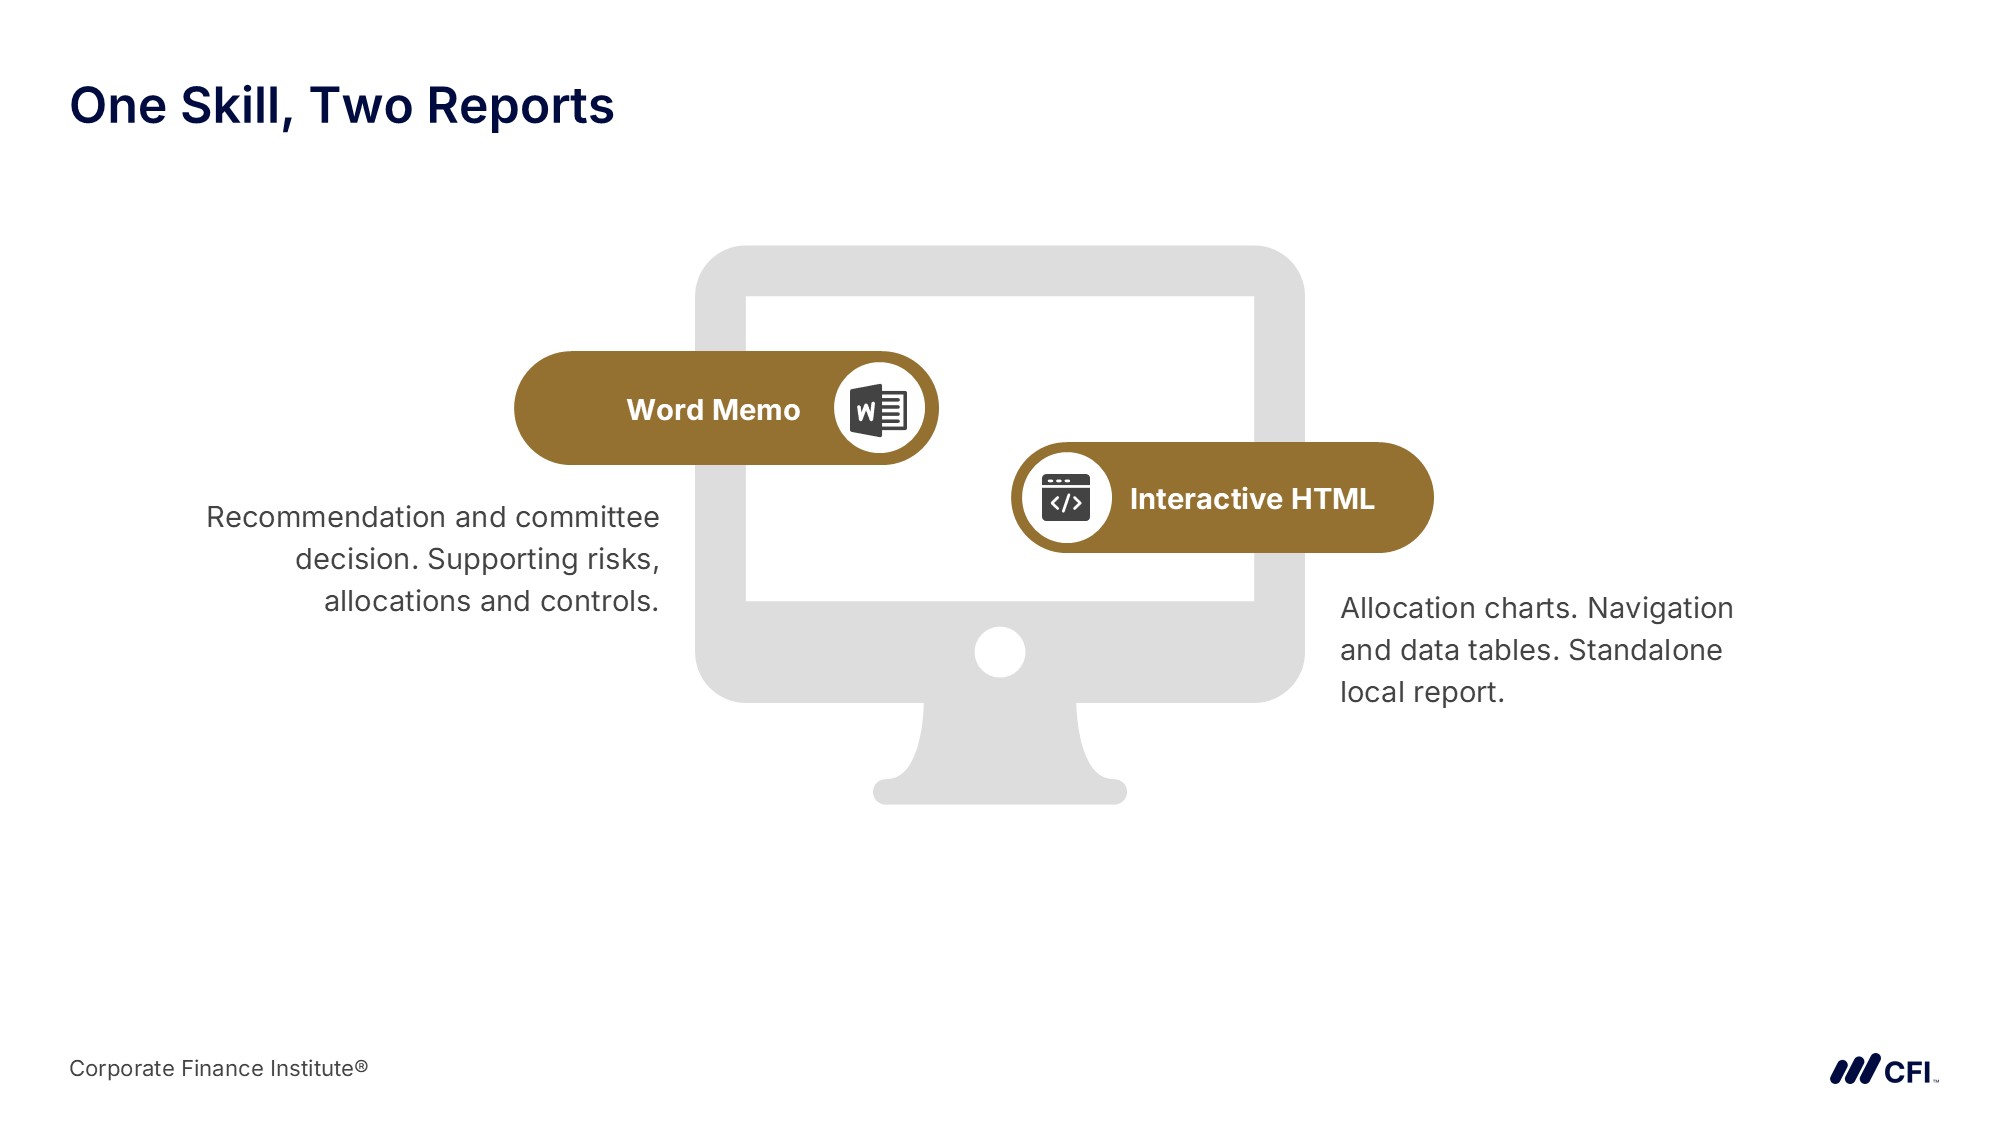
Tools Used in This Course
This course uses Claude and ChatGPT (free and paid versions), Microsoft Copilot (paid version), Gemini (free and paid versions), Claude in Excel (paid), and Microsoft Excel.AI Dashboard Creation and Executive Reporting Learning Objectives
- Describe how the RCCFS structure turns a dashboard request into a brief that states the audience, the decision, the source, the rules, the format and the checks.
- Select whether an HTML or an Excel dashboard suits a given reporting need, and explain why.
- Recognize ways an AI-built dashboard can fail, such as a dashboard that does not load, charts that do not appear, numbers that look right but are wrong, and totals that add what should not be added, and identify the check that catches each.
- Describe how to resolve a problem in an AI-built dashboard by questioning the AI, giving it evidence, and testing the correction.
- Explain how an Excel dashboard built with dynamic array formulas updates its figures and charts when the selection or the data changes, and why that suits a monthly refresh.
- Describe how a reusable AI skill packages instructions, reference methods, and calculations to produce a consistent recommendation from the stated objectives, and why a person still reviews it.
Prerequisite Courses
Recommended courses to complete before taking this course.
Prerequisite Skills
Recommended skills to have before taking this course.
- Excel
AI Dashboard Creation and Executive Reporting
Led by
Cheryl Provorny
Level 3
3h
100% online and self-paced
Start LearningWhat You'll Learn
Lesson
Multimedia
Exams
Files
Data and the Prompt
HTML Dashboards
The Excel Dashboard
Conclusion
Qualified Assessment
Frequently Asked Questions
If you haven’t found your answer from our FAQ, please send us a message.
If you haven’t found your answer from our FAQ, please send us a message.