Time-saving ways to insert formulas into Excel
Excel formulas are essential for financial analysis, helping professionals perform calculations, analyze data, and generate insights with precision. A formula in Excel is an expression that computes values based on numbers, cell references, and operators, while functions—predefined formulas—simplify complex calculations like summing totals, finding averages, or analyzing trends.
Understanding how to use Excel formulas allows professionals to automate workflows, improve reporting accuracy, and perform complex data analysis with ease. When you learn Excel formulas, you can streamline financial modeling, revenue projections, expense tracking, and investment analysis, ensuring efficient data processing while minimizing errors.
Every formula in Excel follows a structured format:
For example, instead of manually adding a column of values, the SUM function (=SUM(A1:A10)) instantly calculates totals. Similarly, an IF statement (=IF(A1>100, “Above Target”, “Below Target”)) automates decision-making in financial reports.
Excel formulas eliminate repetitive manual calculations, allowing professionals to perform complex calculations in Excel with greater accuracy in financial modeling, reporting, and valuation. Whether you work in finance, accounting, or data science, mastering Excel’s built-in functions enhances data integrity, speed, and precision. As you learn Excel formulas, you gain the ability to automate workflows and analyze data more efficiently.
Excel spreadsheet formulas are essential for finance, accounting, and business analytics, allowing professionals to perform calculations, automate workflows, and analyze large datasets with precision. From financial modeling to risk assessment, these functions enhance reporting accuracy, improve decision-making efficiency, and reduce manual errors.
Mastering Excel ensures greater efficiency and precision in corporate finance and investment analysis, whether using the SUM function to total financial data or applying VLOOKUP for reconciliations.
Mastering basic Excel functions is critical for beginners to become highly proficient in financial analysis. Microsoft Excel is considered the industry standard piece of software in data analysis. Microsoft’s spreadsheet program also happens to be one of the most preferred software by investment bankers and financial analysts in data processing, financial modeling, and presentation.
This guide will provide an overview and list of some basic formulas for Excel.
Once you’ve mastered this list, move on to CFI’s Advanced Excel Formulas guide!
There are two basic ways to perform calculations in Excel: Formulas and Functions.
In Excel, a formula is an expression that operates on values in a range of cells or a cell. For example, =A1+A2+A3, which finds the sum of the range of values from cell A1 to cell A3.
Functions are predefined formulas in Excel. They eliminate laborious manual entry of formulas while giving them human-friendly names. For example: =SUM(A1:A3). The function sums all the values from A1 to A3.
There are five common ways of inserting basic Excel formulas when analyzing data. Each strategy comes with its own advantages. Therefore, before diving further into the main formulas, we’ll clarify those methods so you can create your preferred workflow earlier on in the process.
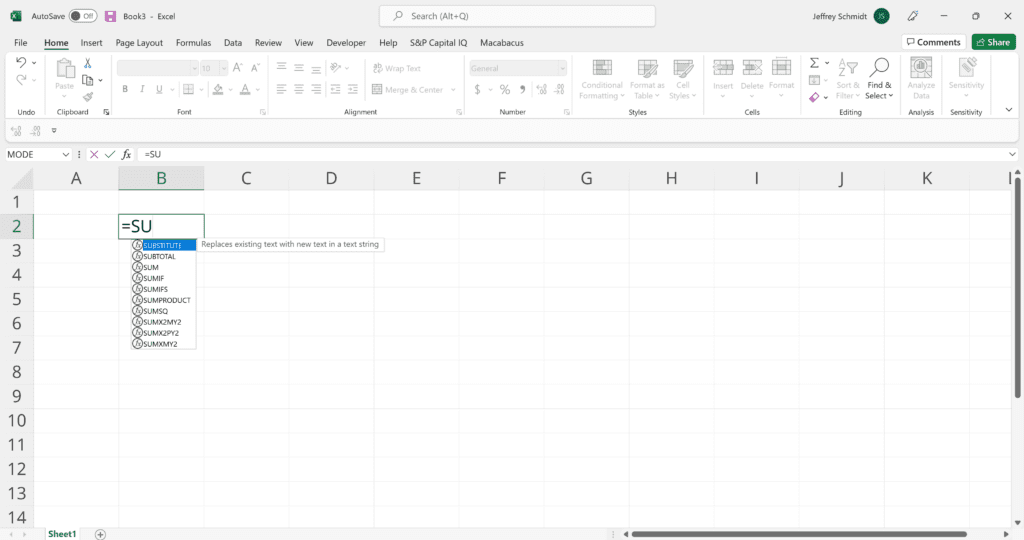
Typing a formula in a cell or the formula bar is the most straightforward method of inserting basic Excel formulas for beginners. The process usually starts by typing an equal sign, followed by the name of an Excel function.
Excel is quite intelligent in that when you start typing the name of the function, a pop-up function hint will show (see below). From this list, you’ll select your preference. However, don’t press the Enter key after making your selection. Instead, press the Tab key, and Excel will automatically fill in the function name.
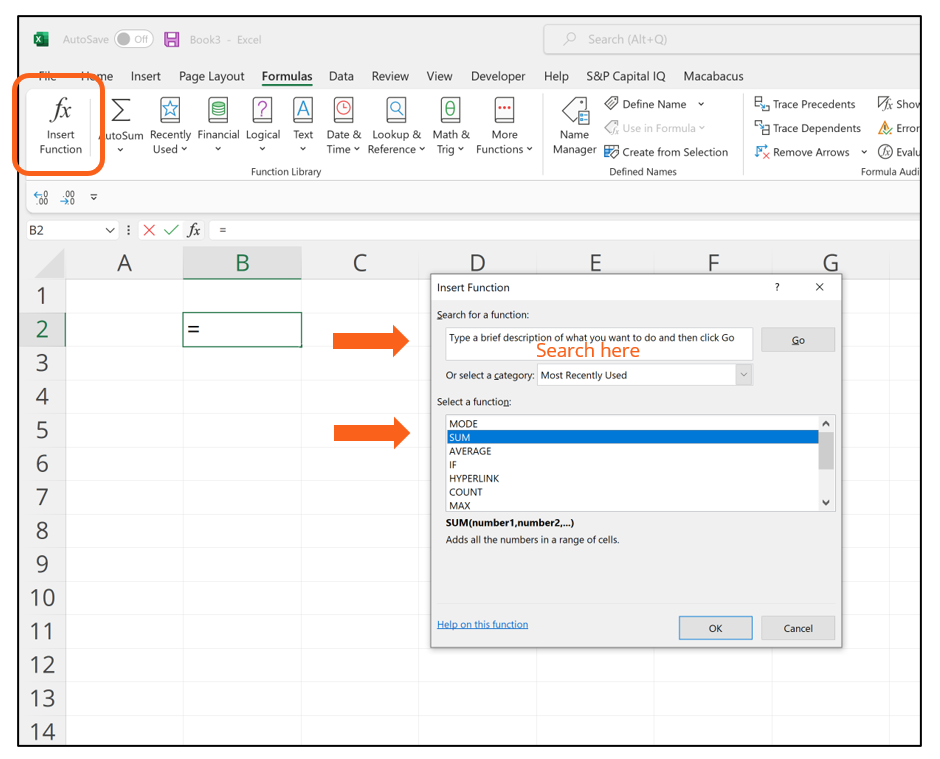
If you want full control of your function’s insertion, using the Excel Insert Function dialog box is all you ever need. To achieve this, go to the Formulas tab and select the first menu labeled Insert Function. The dialogue box will contain all the functions you need to complete your financial analysis.
Example of how to use the Insert Function option in Excel:
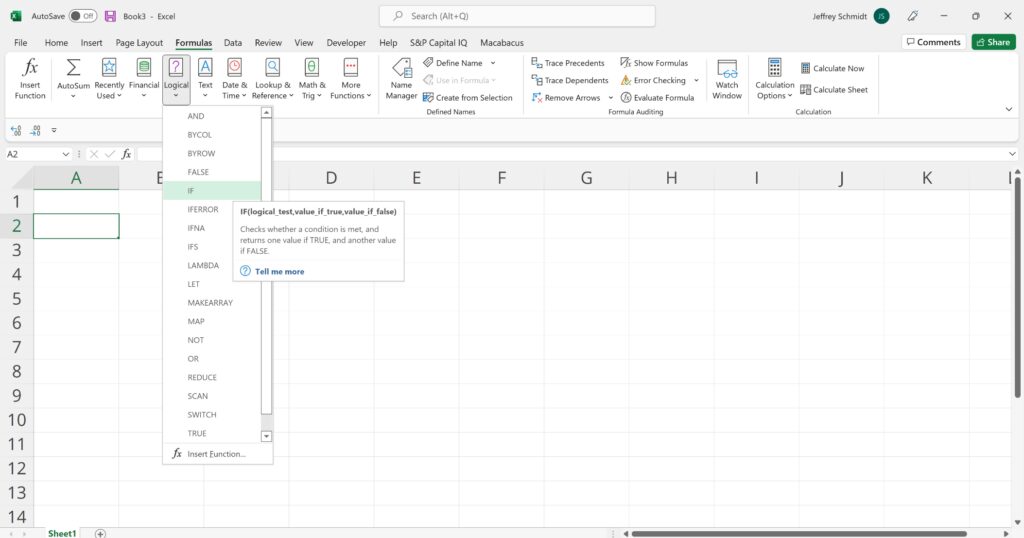
This option is for those who want to quickly delve into their favorite functions. To find this menu, navigate to the Formulas tab and select your preferred group. Click to show a sub-menu filled with a list of functions.
From there, you can select your preference. However, if your preferred group is not on the tab, click on the More Functions option—it’s probably hidden there.
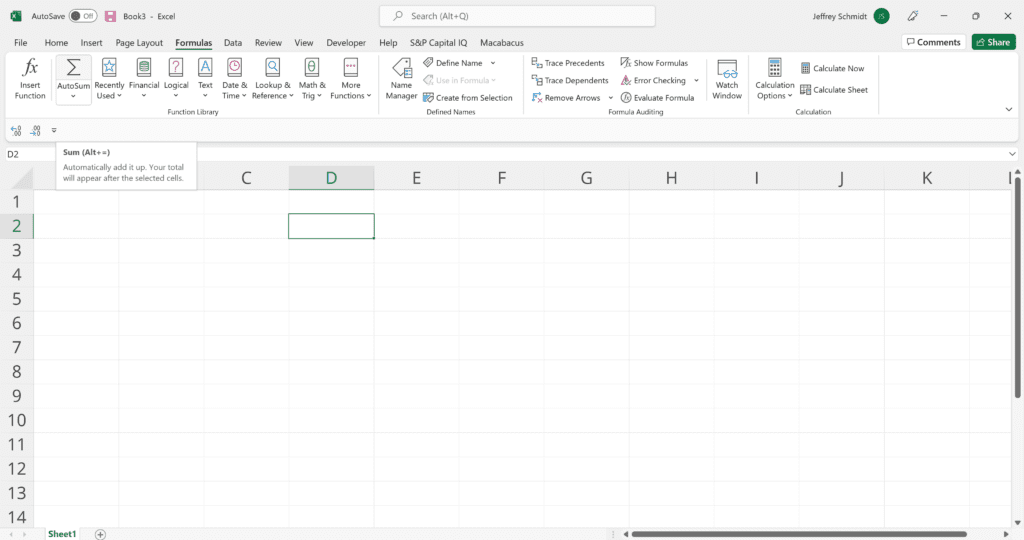
For quick and everyday tasks, the AutoSum function is your go-to option. Navigate to the Formulas tab and click the AutoSum option. Then click the caret to show other hidden formulas. This option is also available in the Home tab.
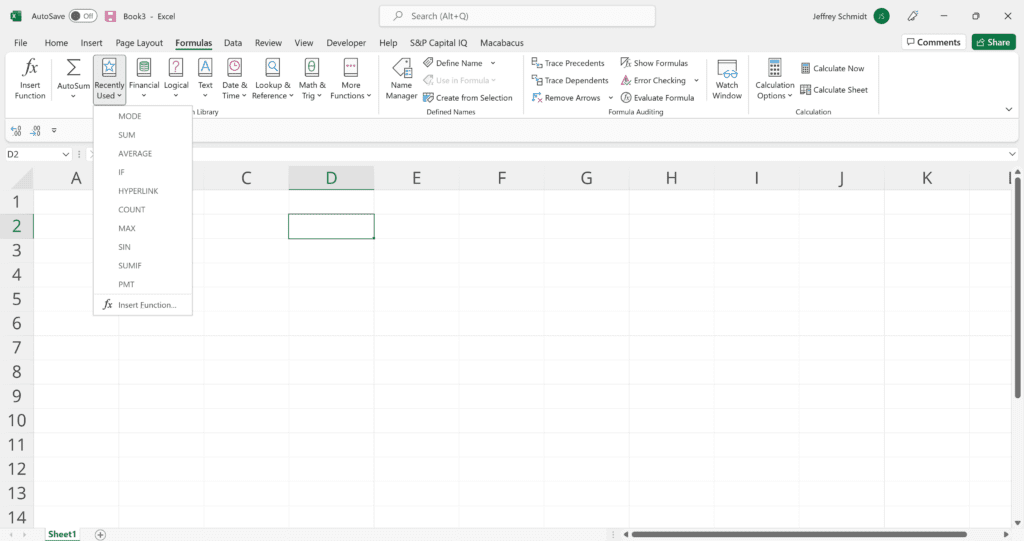
If retyping your most recent formula is a monotonous task, use the Recently Used selection. It’s on the Formulas tab, a third menu option just next to AutoSum.
Now that you know how to insert functions, here are Excel formula examples for beginners to get started:
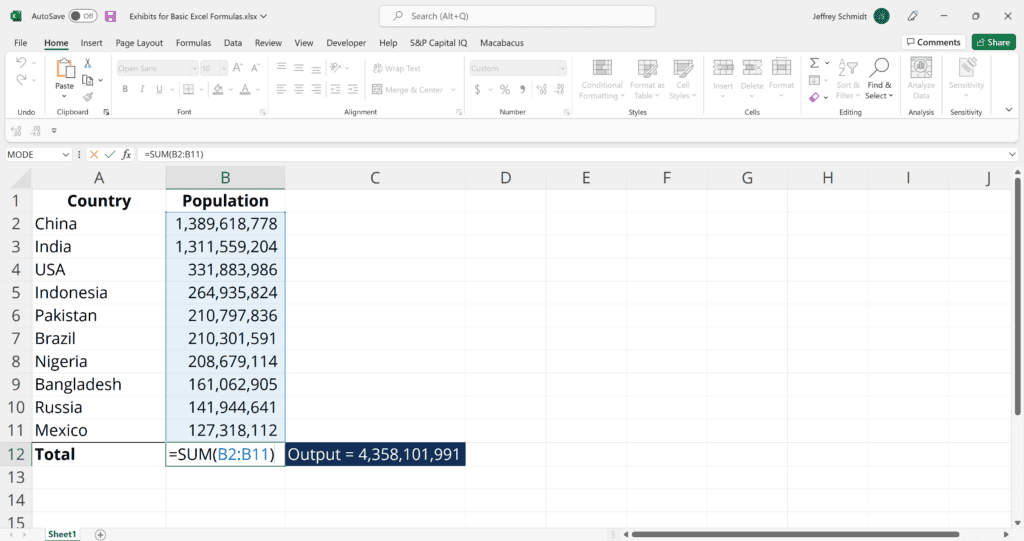
The SUM function is the first must-know formula in Excel. It usually aggregates values from a selection of columns or rows from your selected range.
=SUM(number1, [number2], …)
Example:
=SUM(B2:G2) – A simple selection that sums the values of a row.
=SUM(A2:A8) – A simple selection that sums the values of a column.
=SUM(A2:A7, A9, A12:A15) – A sophisticated collection that sums values from range A2 to A7, skips A8, adds A9, jumps A10 and A11, then finally adds from A12 to A15.
=SUM(A2:A8)/20 – Shows you can also turn your function into a formula.
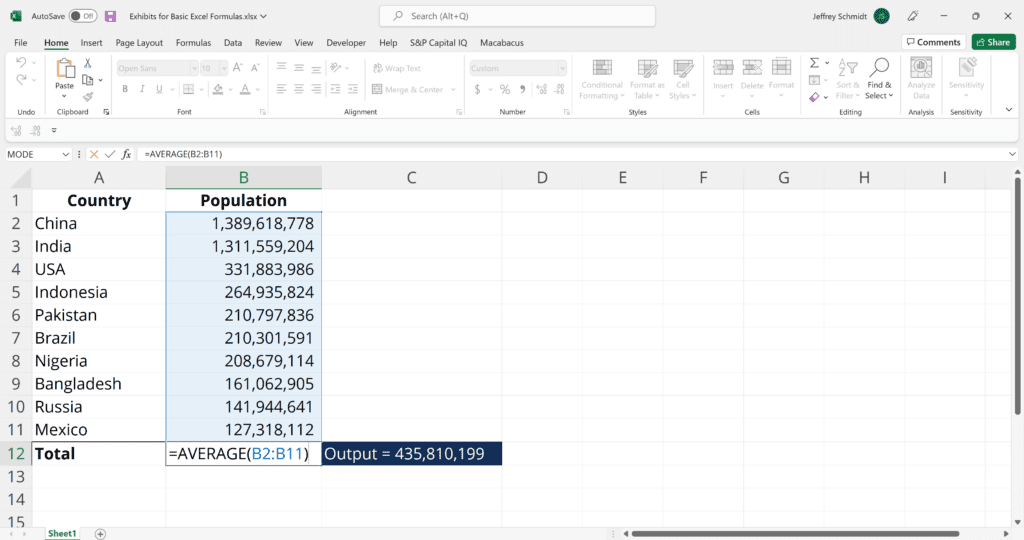
The AVERAGE function should remind you of simple averages of data, such as the average number of shareholders in a given shareholding pool.
=AVERAGE(number1, [number2], …)
Example:
=AVERAGE(B2:B11) – Shows a simple average, also similar to (SUM(B2:B11)/10)
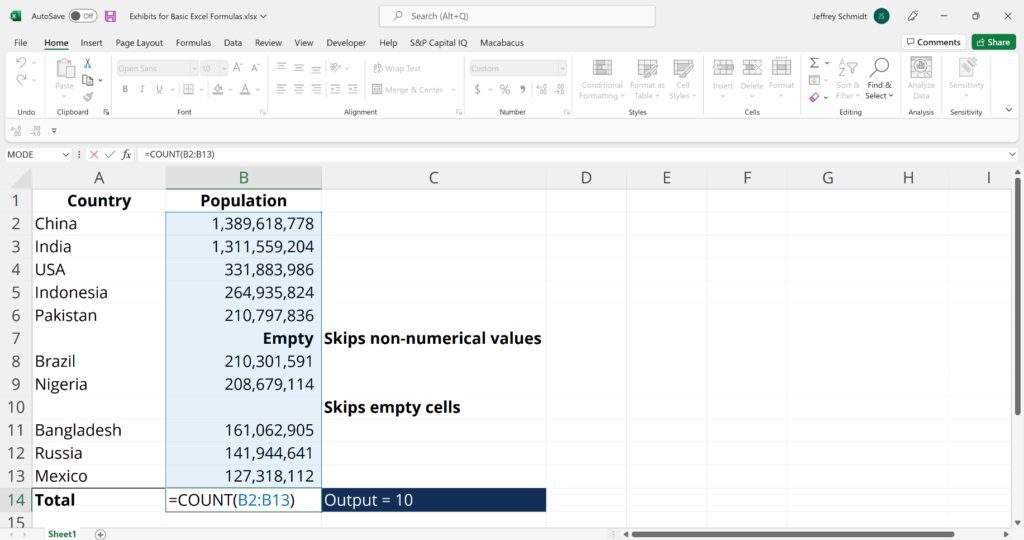
The COUNT function counts all cells in a given range that contain only numeric values.
=COUNT(value1, [value2], …)
Example:
COUNT(A:A) – Counts all values that are numerical in A column. However, you must adjust the range inside the formula to count rows.
COUNT(A1:C1) – Now it can count rows.
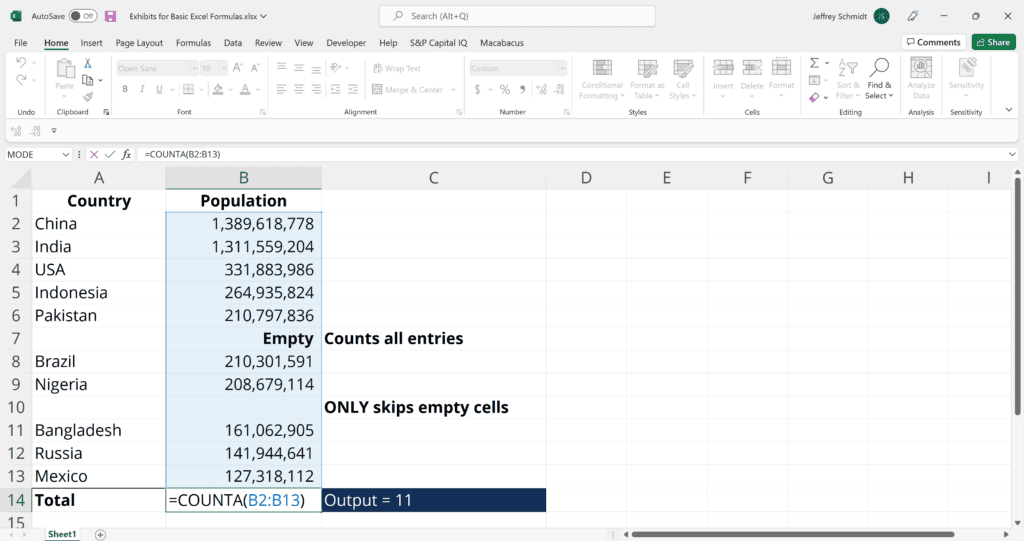
Like the COUNT function, COUNTA counts all cells in a given range. However, it counts all cells regardless of type. Unlike COUNT, which only counts numerics, it also counts dates, times, strings, logical values, errors, empty string, or text.
=COUNTA(value1, [value2], …)
Example:
COUNTA(C2:C13) – Counts rows 2 to 13 in column C regardless of type. However, like COUNT, you can’t use the same formula to count rows. You must make an adjustment to the selection inside the brackets – for example, COUNTA(C2:H2) will count columns C to H
The IF function is often used when you want to sort your data according to a given logic. The best part of the IF formula is that you can embed formulas and functions in it.
=IF(logical_test, [value_if_true], [value_if_false])
Example:
=IF(C2<D3,“TRUE”,”FALSE”) – Checks if the value at C3 is less than the value at D3. If the logic is true, let the cell value be TRUE, otherwise, FALSE
=IF(SUM(C1:C10) > SUM(D1:D10), SUM(C1:C10), SUM(D1:D10)) – An example of a complex IF statement. First, it sums C1 to C10 and D1 to D10, then it compares the sum. If the sum of C1 to C10 is greater than the sum of D1 to D10, then it makes the value of a cell equal to the sum of C1 to C10.
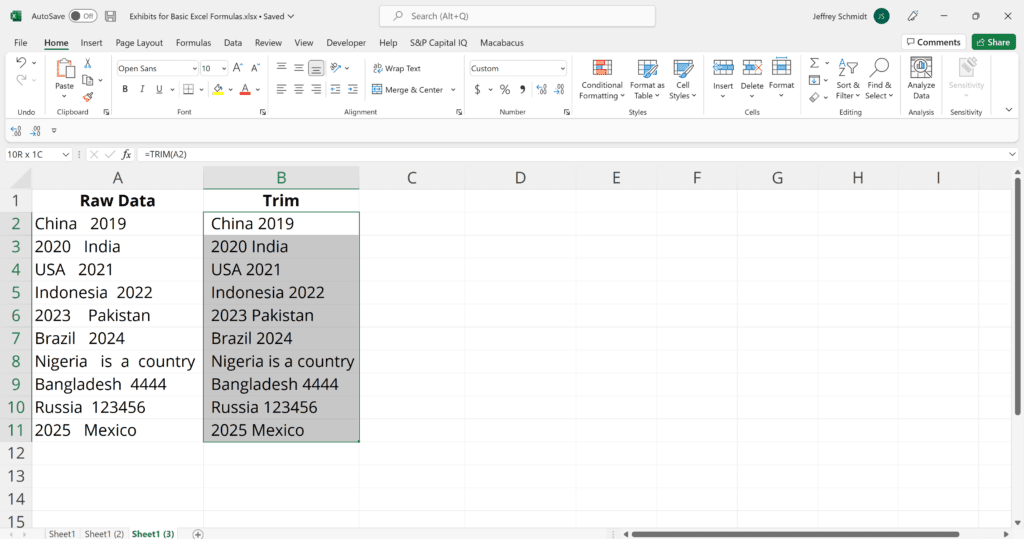
The TRIM function makes sure your functions do not return errors due to extra spaces in your data. It ensures that all empty spaces are eliminated. Unlike other functions that can operate on a range of cells, TRIM only operates on a single cell. Therefore, it comes with the downside of adding duplicated data to your spreadsheet.
=TRIM(text)
Example:
TRIM(A2) – Removes empty spaces in the value in cell A2.
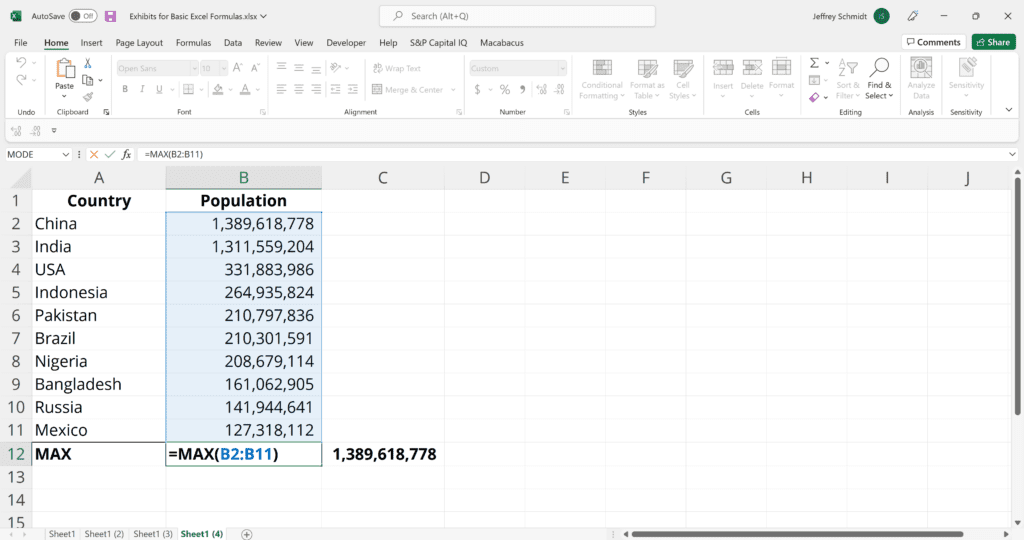
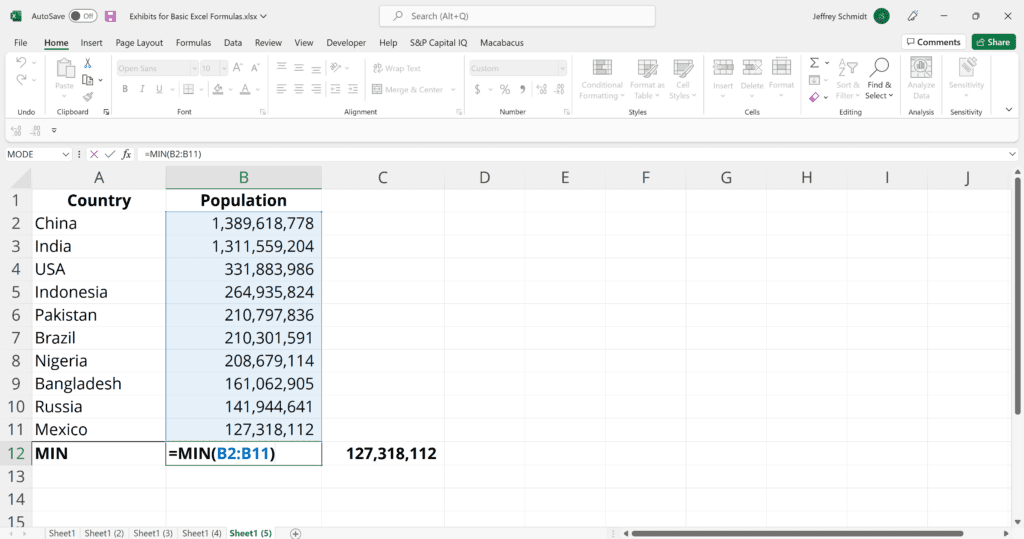
The MAX and MIN functions help find the maximum and minimum numbers in a range of values.
=MIN(number1, [number2], …)
Example:
=MIN(B2:C11) – Finds the minimum number between column B from B2 and column C from C2 to row 11 in both columns B and C.
=MAX(number1, [number2], …)
Example:
=MAX(B2:C11) – Similarly, it finds the maximum number between column B from B2 and column C from C2 to row 11 in both columns B and C.
Building on basic formulas for Excel, advanced functions help automate tasks, improve accuracy, and enhance financial modeling for data-driven decision-making. Once you’re comfortable with the basics, these advanced formulas will help you perform more complex financial analyses with greater efficiency.
1. TEXTJOIN (Combining Text Efficiently)
TEXTJOIN merges multiple text values while allowing for a custom delimiter and the option to ignore empty cells. This function is particularly useful for generating structured financial summaries, consolidating transaction details, or formatting ledger descriptions.
Example:
TEXTJOIN(“, “, TRUE, A2:A10) – Joins text from A2 to A10 with a comma separator, commonly used to merge financial categories, invoice descriptions, or structured account information.
2. CONCATENATE (Merging Text Without Delimiters)
While TEXTJOIN is the preferred method, CONCATENATE is still used in older Excel versions to combine text values. Unlike TEXTJOIN, it does not allow custom separators or the option to ignore empty cells.
Example:
CONCATENATE(A2,” “, B2) – Merges A2 and B2 with a space in between, commonly used for combining first and last names in customer databases.
3. LEN (Validating Text Length in Financial Data)
LEN calculates the number of characters in a text string, making it useful for validating account numbers, tax identification numbers, and transaction codes to ensure compliance with regulatory standards.
Example:
LEN(A2) – Returns the number of characters in A2, ensuring financial records meet standard length requirements.
4. REPLACE (Modifying Text Based on Position)
REPLACE allows users to substitute a portion of a text string based on position and length, making it ideal for updating outdated financial codes or adjusting standardized product IDs.
Example:
REPLACE(A2, 5, 3, “XYZ”) – Replaces three characters starting at position 5 with “XYZ,” often used for updating reference codes in compliance reports.
These text functions are essential for automating data organization, ensuring accuracy in financial records, and streamlining reporting workflows. By mastering these tools, professionals can enhance efficiency in financial modeling and regulatory compliance.
Time-based calculations are essential for loan amortization, revenue forecasting, and financial compliance. Excel’s Date and Time functions automate real-time tracking of financial events, interest accruals, and investment performance, ensuring that financial models remain accurate and up to date. These functions are widely used in corporate accounting, project finance, and financial reporting to eliminate manual errors and standardize time-sensitive calculations.
1. TODAY (Real-Time Date Updates for Financial Models)
The TODAY function dynamically returns the current date, making it invaluable for automated financial reports, loan repayment schedules, and fiscal closing dates. It ensures that time-sensitive calculations remain accurate without requiring manual updates.
Example:
TODAY() – Returns today’s date, commonly used in aging reports, due date tracking, and financial period cutoffs.
2. NOW (Timestamping Financial Transactions and Reports)
The NOW function provides both the current date and time, making it ideal for time-stamping transactions, tracking real-time market data, and recording financial activities.
Example:
NOW() – Returns the current date and time, frequently used for automated log entries in dashboards and real-time portfolio tracking.
3. DATEDIF (Measuring Time Intervals in Financial Analysis)
The DATEDIF function calculates the difference between two dates in years, months, or days, making it useful for bond maturity tracking, employee tenure analysis, and lease contract durations. However, it does not handle negative values or built-in error handling, which can cause issues in scenarios requiring retrospective calculations.
Example:
DATEDIF(A2, B2, “Y”) – Calculates the number of years between two dates, commonly used in investment holding period calculations and pension eligibility assessments.
4. YEARFRAC (Pro-Rata Interest and Lease Expense Calculations)
The YEARFRAC function calculates the fraction of a year between two dates, allowing for precise pro-rata calculations in interest accrual models, lease agreements, and revenue recognition under IFRS reporting. Unlike DATEDIF, it accounts for partial periods, making it more accurate for financial forecasting.
Example:
YEARFRAC(A2, B2, 1) – Returns the fraction of a year between two dates, often used for pro-rated interest expense calculations and financial accruals.
Using TODAY and NOW keeps financial models up to date without manual edits, while YEARFRAC and DATEDIF track long-term financial commitments with precision. Mastering these functions sharpens forecasting, risk assessment, and compliance reporting, ensuring data-driven accuracy.
Lookup functions allow financial professionals to extract key data points from large datasets, automating portfolio tracking, valuation modeling, and corporate financial reporting. These functions reduce manual searches, improve data accuracy, and ensure that investment analysis, budget comparisons, and revenue tracking remain dynamic and up to date.
By integrating Lookup functions into financial workflows, analysts can streamline data retrieval across reports, match transactions efficiently, and enhance real-time decision-making.
1. VLOOKUP (Retrieving Data from Structured Financial Tables)
VLOOKUP searches for a value in the first column of a dataset and returns a corresponding value from another column. It is commonly used in financial statement reconciliations, expense categorization, and retrieving revenue figures from general ledgers. However, VLOOKUP can only search downward from the first column, making it less flexible for datasets requiring leftward lookups or dynamic range adjustments.
Example:
VLOOKUP(101, A2:C10, 3, FALSE) – Finds account number 101 in column A and returns its balance from column C, commonly applied in financial statement audits and ledger verifications.
2. INDEX-MATCH (Flexible Bidirectional Lookups for Financial Models)
Unlike VLOOKUP, the INDEX-MATCH combination allows for lookups in any direction, making it ideal for multi-dimensional financial models. It does not require sorted data and is commonly used in investment performance tracking, budget forecasts, and multi-year financial modeling.
Example:
INDEX(B2:B10, MATCH(“January”, A2:A10, 0)) – Retrieves January’s sales revenue from a dataset, frequently used in financial forecasting and trend analysis.
3. XLOOKUP (Advanced Lookups for Real-Time Financial Dashboards)
XLOOKUP removes the limitations of VLOOKUP and INDEX-MATCH by supporting bidirectional lookups, dynamic array returns, and enhanced error handling. It is particularly useful for real-time financial reporting dashboards, investment tracking, and retrieving market data from external sources. However, XLOOKUP is only available in Excel 2019 and later—users on earlier versions should rely on INDEX-MATCH for similar functionality.
Example:
XLOOKUP(“AAPL”, A2:A100, B2:B100) – Finds the latest stock price for AAPL, commonly used in investment research and real-time market analysis.
Lookup formulas eliminate manual work, speed up data retrieval, and enhance accuracy in financial forecasting. Whether pulling live stock prices, linking financial statements, or validating cash flow projections, these functions keep financial data in real-time and reliable. Industry experts emphasize that working on hands-on projects is the best way to learn Excel formulas and apply them effectively in financial modeling and reporting.
Thank you for reading CFI’s guide to basic Excel formulas for beginners. To continue your development as a world-class financial analyst, these additional CFI resources will be helpful:
In CFI’s “Excel Fundamentals – Formulas for Finance” course, you will learn all the basic functions to perform statistical analysis on data sets in Excel 365, including aggregation, date functions, and lookup functions.
– Explore the Excel 365 interface and focus on the features that are the most common within the finance industry.
– Compare various financial analysis functions to understand their advantages and disadvantages.
– Practice using tools and shortcuts improve your speed and accuracy with the keyboard.
Access and download collection of free Templates to help power your productivity and performance.
Already have an account? Log in
Take your learning and productivity to the next level with our Premium Templates.
Upgrading to a paid membership gives you access to our extensive collection of plug-and-play Templates designed to power your performance—as well as CFI's full course catalog and accredited Certification Programs.
Already have a Self-Study or Full-Immersion membership? Log in
Gain unlimited access to more than 250 productivity Templates, CFI's full course catalog and accredited Certification Programs, hundreds of resources, expert reviews and support, the chance to work with real-world finance and research tools, and more.
Already have a Full-Immersion membership? Log in