Get Certified for
Capital Markets (CMSA®)
From equities and fixed income to derivatives, the CMSA certification bridges the gap from where you are now to where you want to be — a world-class capital markets analyst.
A technical momentum indicator that measures the trend in prices and identify trend reversals
The slow stochastic indicator is a technical momentum indicator that aims to measure the trend in prices and identify trend reversals. George Lane developed the indicator, which is driven by two parameters – the lookback period and the smoothing parameter.
The lookback period is the period over which the oscillator is calculated, and the smoothing parameter is the number of periods over which the moving average of the oscillator is calculated. It is called an oscillator because the value of the indicator oscillates between 0 and 100. It can be computed as follows:
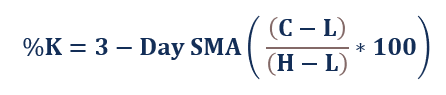
Where:
The lookback period is usually 5 days or 14 days, but it can be any number between 5 days and 21 days. The indicator is not effective over longer periods because, over longer periods, stock prices tend to have an upward trend.
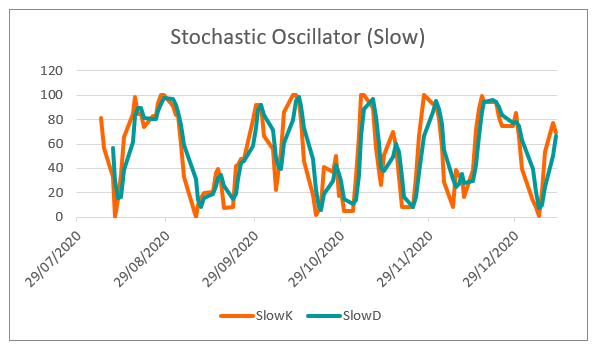
There is also a second quantity computed known as %D, which is the 3-day SMA of the %K. It is a smoothed version of the %K. It is computed because %K is a volatile indicator and can lead to spurious signals. A smoothed version (%D) moves much slower than the %K; hence, the signals generated are indicative of a stronger trend.
The Slow Stochastic Oscillator (%K) is a momentum indicator, and it is used to identify the strength of trends in price movements. It can be used to generate overbought and oversold signals. Typically, a stock is considered overbought if the %K is above 80 and oversold if %K is below 20. Other widely used levels are 75 and 25, respectively.
The levels may be used as buy (%K below 20) or sell (%K above 80) to create a simple mechanical trading strategy. In practice, these thresholds are used in combination with other indicators and serve as warning signals.
Download our free Stochastic Oscillator Excel template, and start modeling today!
The Slow Stochastic Indicator can be easily computed using Excel. The following is a short tutorial on how to calculate the indicator.
Step 1: Collect the daily closing prices of the index or the stock to study.
Step 2: Calculate the Fast Stochastic Oscillator over the desired lookback period (5-21 days). Use the MIN() and MAX() functions to calculate the low price (L) and high price (H), respectively. Compute the Fast %K using the above formula.
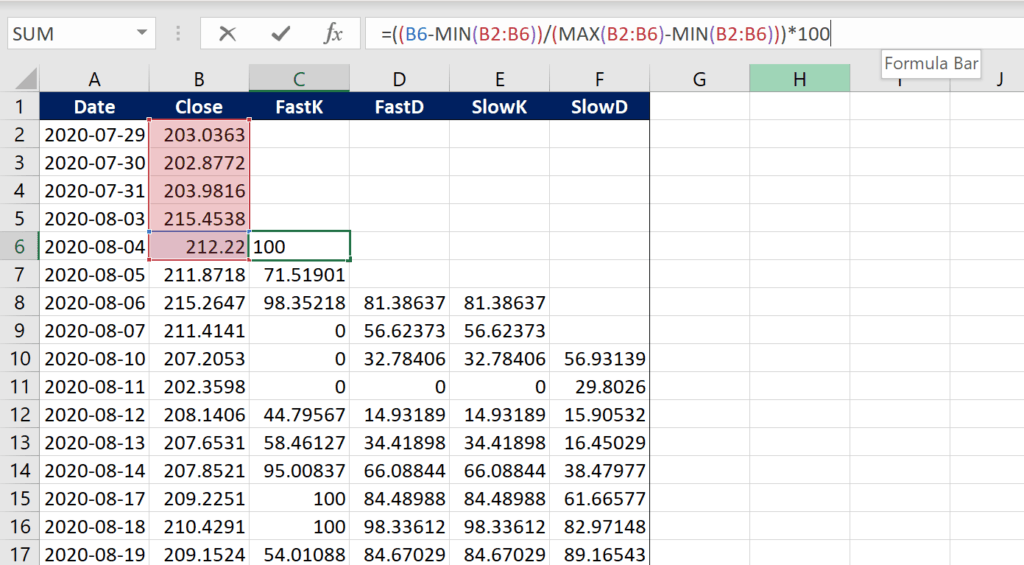
Step 3: Compute the 3-day simple moving average of the Fast Stochastic oscillator (Fast %K) to get the Slow %K.
Step 4: Finally, compute the 3-day simple moving average of the Slow %K. It is the Slow %D.
To learn more about George Lane’s trading strategy, check out our article on Fast Stochastic Indicator.


