Get Certified for
Capital Markets (CMSA®)
From equities and fixed income to derivatives, the CMSA certification bridges the gap from where you are now to where you want to be — a world-class capital markets analyst.
Economic terms used to determine market wellness by studying the relationship between the consumers and suppliers
Both consumer surplus and producer surplus are economic terms used to define market wellness by studying the relationship between consumers and suppliers. They explain the opportunity cost consumers forego to gain a marginal benefit from buying a good or service. To the producer, it is the willingness and ability to produce an extra unit of a product based on the marginal cost of producing more goods.

When discussing consumer and producer surplus, it is important to understand some basic concepts used by economists to explain the interrelationship.
Both consumer and producer surplus can be graphed to display either a demand curve or a marginal benefit curve (MB) and a supply curve or a marginal cost curve (MC).
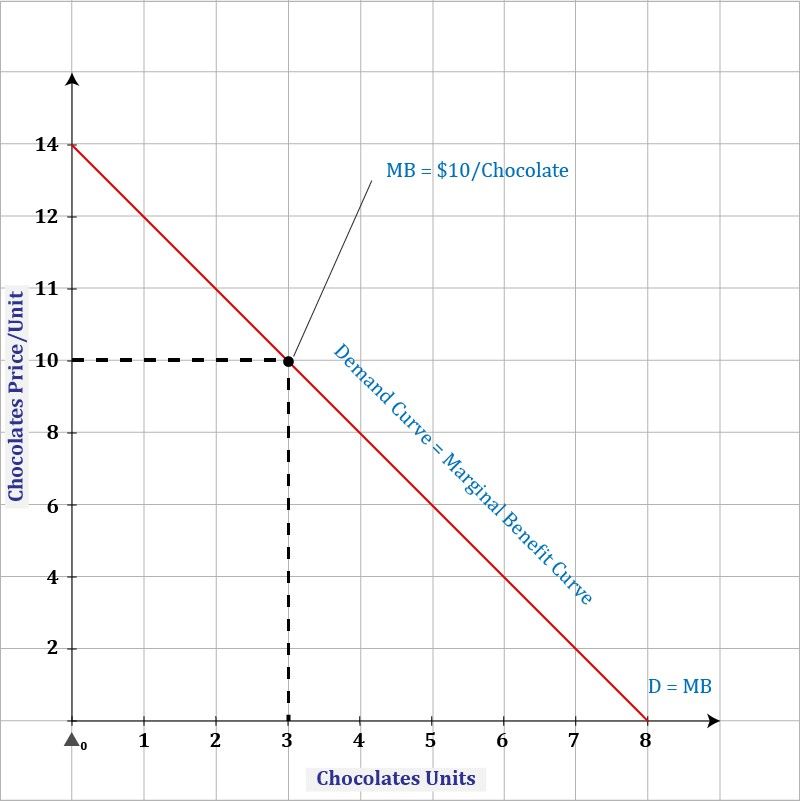
Consumer surplus refers to the monetary gain enjoyed when a purchaser buys a product for less than what they normally would be willing to pay. Each corresponding product unit price along the supply curve is known as the marginal cost (MC).
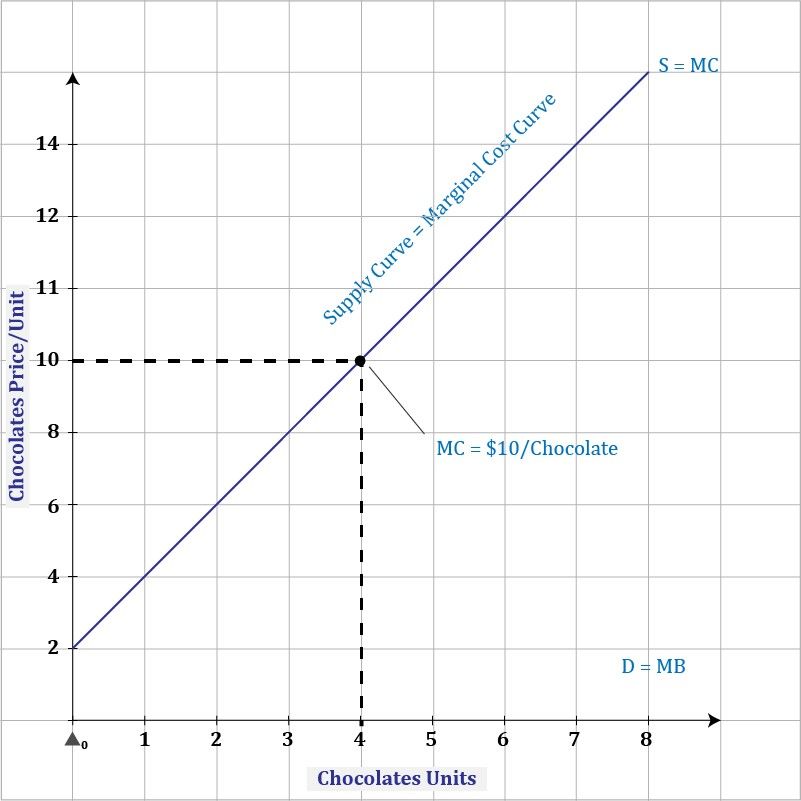
On the other hand, the producer surplus is the price difference between the lowest cost to supply the market and the actual price consumers are willing to pay. The price of a product unit along the supply curve is known as the marginal cost (MC).
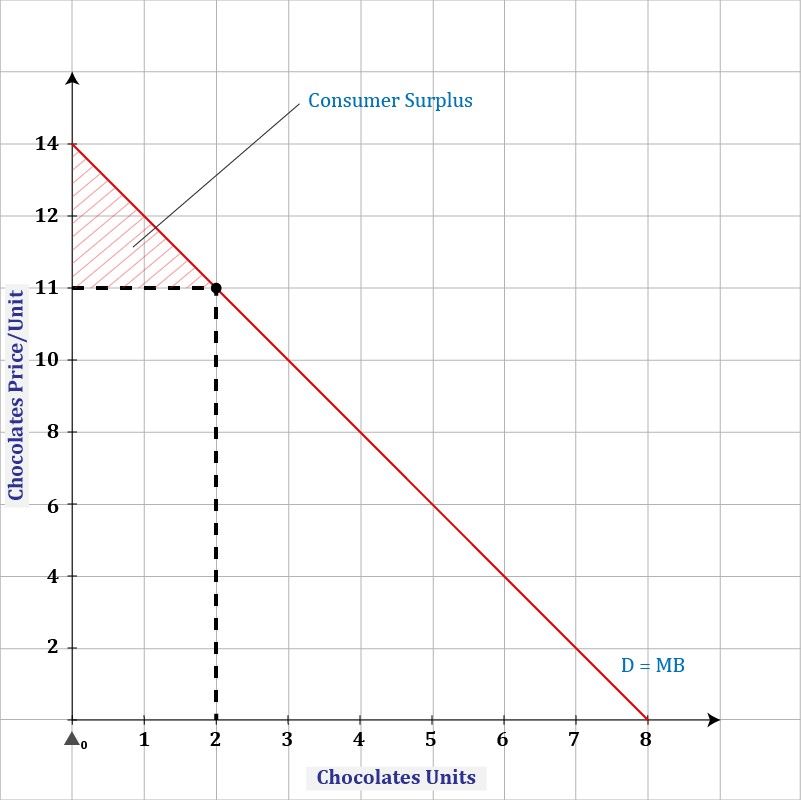
When graphing consumer surplus, the area above every extra unit of consumption is referred to as the total consumer surplus. Similarly, the area above the supply curve for every extra unit brought to the market is referred to as the total producer surplus.
When you add both the consumer and producer surplus, you get the total surplus, also known as total welfare or community surplus. It is used to determine the well-being of the market. When all factors are constant, in a perfect market state, an equilibrium is achieved. This state is also referred to as allocative efficiency – the marginal cost and marginal benefit are equal.

To fully conceptualize consumer surplus, take an example of a demand curve of chocolates plotted on a graph. The unit price is plotted on the Y-axis and the actual chocolate units of demand per day on the X units. The graph below shows the consumer surplus when consumers purchase two units of chocolates.
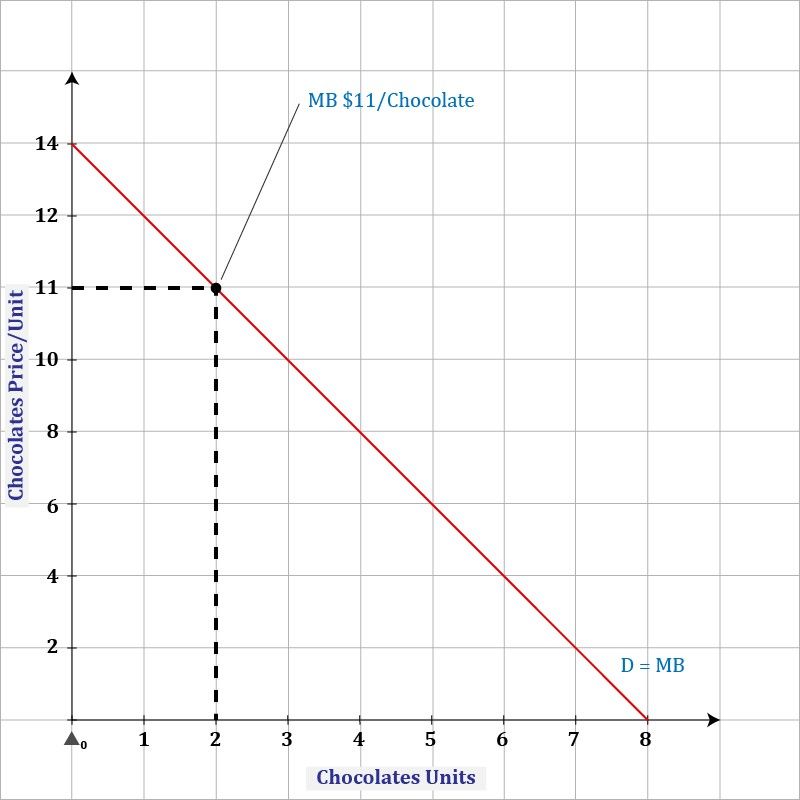
To calculate consumer surplus, account for Δ0 units. In the graph above, the corresponding unit price is $14. It is the market price that consumers are able and willing to purchase a bar of chocolate.
Since the demand curve is linear, the shape formed between Δ0 unit to 2 and below the demand curve is triangular. Therefore, the ordinary formula for finding an area of a triangle is used. The unit items cancel out to leave the result expressed in monetary form.

Where:

In summation, the market saves $3 for the same unit it could’ve purchased for $14.
Using the same example with all the X and Y-axis numbers, the producer surplus is calculated using the same formula. Below is the graph for the illustration:
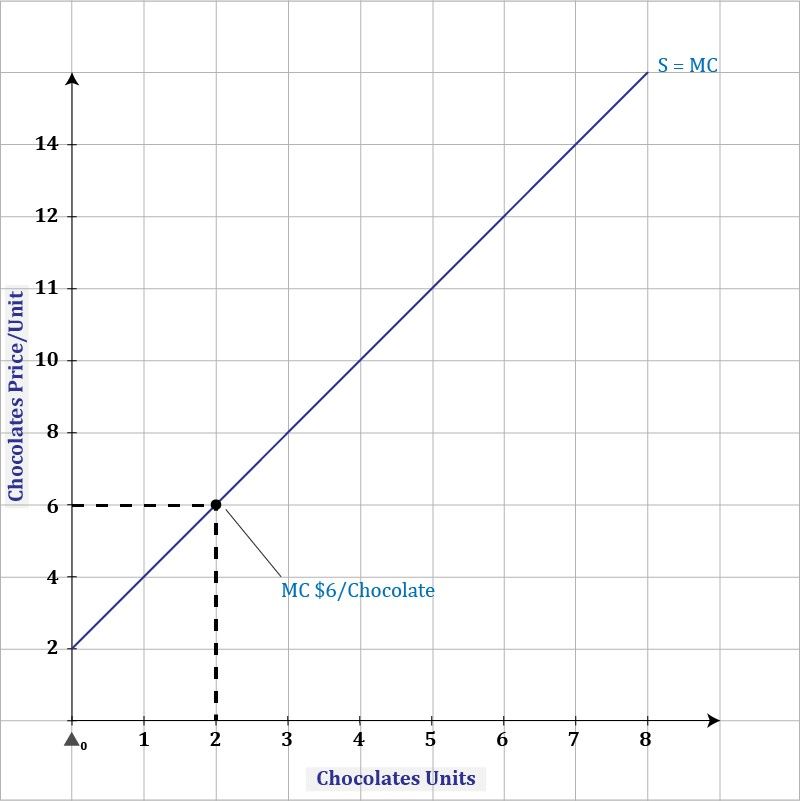
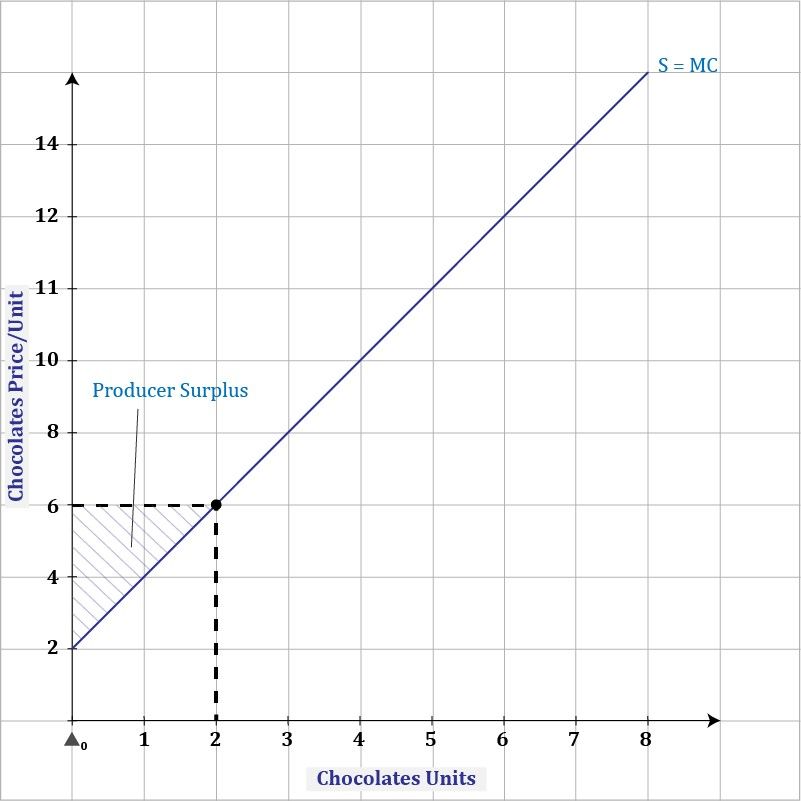
The producer surplus cost at two units is $4 ($6 – $2). This means that the supplier(s) will forego $4 per unit for producing two units.
In the previous example, the total consumer surplus was $3, and the total producer surplus $4, respectively. The total surplus, therefore, will be $7 ($3 + $4). Below is the formula:
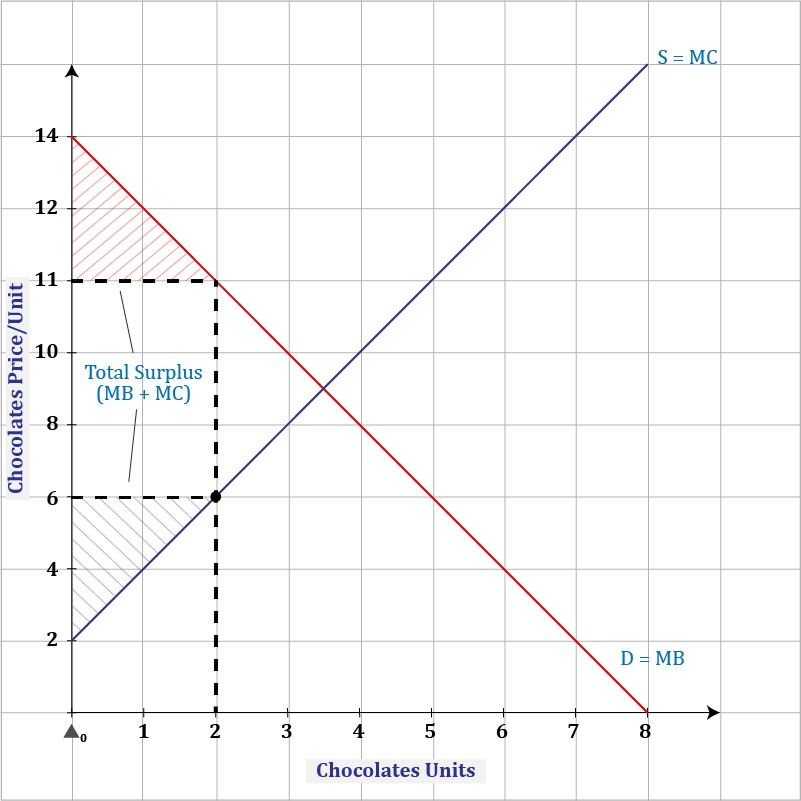
In the above example, the total surplus does not depict the equilibrium. There is a deadweight to shed off. Supplier overheads are higher for producing two units. Similarly, the consumer is getting less than what the market can offer.
As a result, to achieve a stable market, the producer(s) must increase the production to reduce the deadweight and attain the equilibrium. At the equilibrium, the consumer(s) will enjoy the highest marginal utility, and supplier(s) will maximize profits.
Connect what you just learned to a clear career path with CFI’s role‑based courses and certification programs.
CFI is the official provider of the Capital Markets & Securities Analyst (CMSA®) certification program, designed to transform anyone into a world-class financial analyst.
In order to help you become a world-class financial analyst and advance your career to your fullest potential, these additional resources will be very helpful:


