Get Certified for
Capital Markets (CMSA®)
From equities and fixed income to derivatives, the CMSA certification bridges the gap from where you are now to where you want to be — a world-class capital markets analyst.
Loss of economic efficiency when the optimal outcome is not achieved
Deadweight loss refers to the loss of economic efficiency when the equilibrium outcome is not achievable or not achieved. In other words, it is the cost born by society due to market inefficiency.
Below is a short video tutorial that describes what deadweight loss is, provides the causes of deadweight loss, and gives an example calculation.
Deadweight loss also arises from imperfect competition, such as oligopolies and monopolies. In imperfect markets, companies restrict supply to increase prices above their average total cost. Higher prices restrict consumers from enjoying the goods and, therefore, create a deadweight loss.
Imagine that you want to go on a trip to Vancouver. A bus ticket to Vancouver costs $20, and you value the trip at $35. In this situation, the value of the trip ($35) exceeds the cost ($20) and you would, therefore, take this trip. The net value that you get from this trip is $35 – $20 (benefit – cost) = $15.
Before buying a bus ticket to Vancouver, the government suddenly decides to impose a 100% tax on bus tickets. Therefore, this would drive the price of bus tickets from $20 to $40. Now, the cost exceeds the benefit; you are paying $40 for a bus ticket, from which you only derive $35 of value.
In such a scenario, the trip would not happen, and the government would not receive any tax revenue from you. The deadweight loss is the value of the trips to Vancouver that do not happen because of the tax imposed by the government.
Consider the graph below:

At equilibrium, the price would be $5 with a quantity demand of 500.
In addition, regarding consumer and producer surplus:
Let us consider the effect of a new after-tax selling price of $7.50:
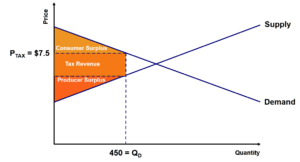
The price would be $7.50 with a quantity demand of 450. Taxes reduce both consumer and producer surplus. However, taxes create a new section called “tax revenue.” It is the revenue collected by governments at the new tax price.
With this new tax price, there would be a deadweight loss:
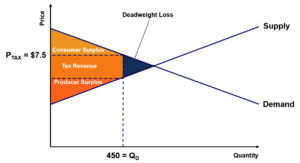
As illustrated in the graph, deadweight loss is the value of the trades that are not made due to the tax. The blue area does not occur because of the new tax price. Therefore, no exchanges take place in that region, and deadweight loss is created.
To figure out how to calculate deadweight loss from taxation, refer to the graph shown below:
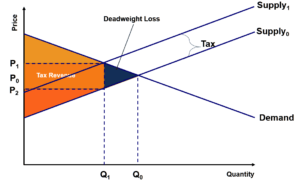
The deadweight loss is represented by the blue triangle and can be calculated as follows:
![]()
Connect what you just learned to a clear career path with CFI’s role‑based courses and certification programs.
Thank you for reading CFI’s guide to Deadweight Loss. To keep learning and advancing your career, the following resources will be helpful:


