Charts and Graphs Template
Charts and Graphs Template
This charts and graphs template provides you with 10 different types of charts and graphs used in financial planning and analysis.
Here is a preview of the charts and graphs template:
Download the Free Template
Download CFI’s free Excel template now to advance your finance knowledge and perform better financial analysis.
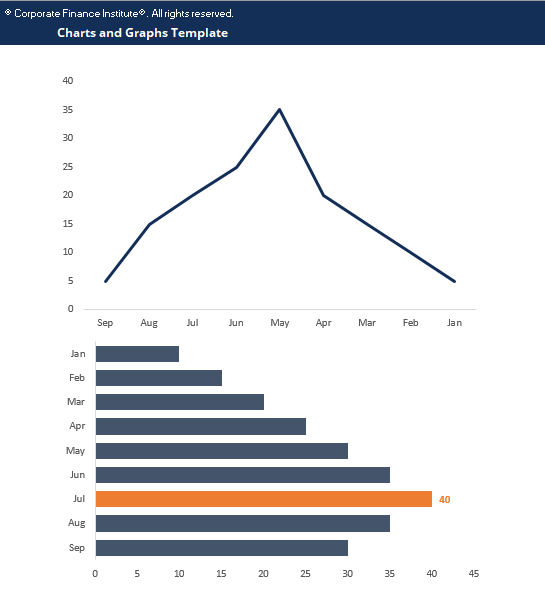
#1 Line Graphs
The perfect solution for showing multiple series of closely related series of data.
#2 Bar Graphs
Bars (columns) are the best types of graphs for presenting a single data series.
#3 Combo Chart
This is very useful when presenting two data services that have a very different scale and might be expressed in different units.
#4 Scatterplot
The scatterplot is excellent for showing the relationship between two data series and determining their correlation.
#5 Waterfall Chart
The waterfall chart is excellent for variance analysis and explaining how an “actual” result was different than a “budget” or how something has changed relative to an original data point.
#6 Pie Graph
A pie graph is effective for illustrating the percentage breakdown of a small number of data points.
#7 Histogram
Histograms show the distribution of a dataset.
#8 Gauge Chart
The gauge chart is perfect for graphing a single data point and showing where that result fits on a scale from “bad” to “good.”
#9 Area Graph
An area chart is a solid area and can be effective when showing stacked, cumulative data series.
#10 Spider chart / radar graph
A spider or radar graph is a very useful type of graph for showing qualitative data or the overall “score” or comparison of multiple series.
More Free Templates
For more resources, check out our business templates library to download numerous free Excel modeling, PowerPoint presentation, and Word document templates.
Analyst Certification FMVA® Program
Below is a break down of subject weightings in the FMVA® financial analyst program. As you can see there is a heavy focus on financial modeling, finance, Excel, business valuation, budgeting/forecasting, PowerPoint presentations, accounting and business strategy.

A well rounded financial analyst possesses all of the above skills!
Additional Questions & Answers
CFI is the global institution behind the financial modeling and valuation analyst FMVA® Designation. CFI is on a mission to enable anyone to be a great financial analyst and have a great career path. In order to help you advance your career, CFI has compiled many resources to assist you along the path.
In order to become a great financial analyst, here are some more questions and answers for you to discover:
- What is Financial Modeling?
- How Do You Build a DCF Model?
- What is Sensitivity Analysis?
- How Do You Value a Business?
Excel Tutorial
To master the art of Excel, check out CFI’s Excel Crash Course, which teaches you how to become an Excel power user. Learn the most important formulas, functions, and shortcuts to become confident in your financial analysis.

Launch CFI’s Excel Crash Course now to take your career to the next level and move up the ladder!


