Excel Waterfall Chart Template
Download our free Excel waterfall template
How to Create an Excel Waterfall Chart
In Excel 2016, Microsoft finally added a Waterfall chart[1] option. It’s a great way to visually show the effect of positive and negative cash flows on a cumulative basis. If you’re working in Excel 2013 or earlier version, please follow the instructions below as a workaround to build your own waterfall chart using the Up/Down Bars and Error Bars features. Finally, at the bottom of the article, you can download our Excel Waterfall Chart Template.
To learn more, launch our Excel training courses online.
Step 1 – Create a Data Table with 7 Columns
In order to build your own waterfall chart, you first have to organize your data as follows:
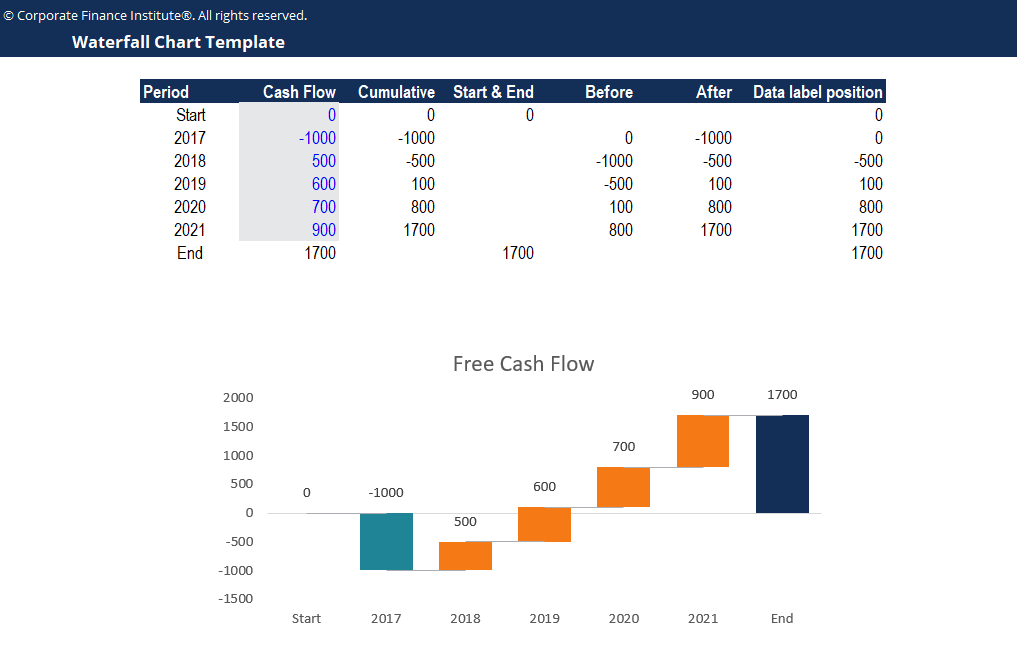
- Period: includes a start, end, and all the years/periods to show in the waterfall
- Cash Flow: the amount of cash flow for each period (only enter data in the grey cells; the end period should have a formula =SUM(D5:D10) in cell D11)
- Cumulative: sum of current and all previous period’s cash flows (enter =SUM($D$5:D5) in cell E5 and copy down until E10); this column is used to build the connectors later
- Start & End: the start and end cash flows are linked to cell F5 and F11 and will be used to create column charts (show as the total columns)
- Before: input =E5 in cell G6 and copy down to G10
- After: input =E6 in cell H6 and copy down to G10
- Data label position: will be used to create a scatter plot to add data labels to the correct positions; enter formula =MAX(F5:H5) in cell I5 and copy down to I11
Step 2 – Build the Waterfall Chart Using Up/Down Bars
- Select cell F4 to H11, press ALT + N + C to insert column charts.
- Right-click on the chart and select Change Chart Type; change chart type of Before and After Series to Line.
- Click either of the Before or After Series Lines, click the green plus button on the top right corner of the waterfall chart and check the box for Up/Down Bars.
- The Up-Bars show positive changes, while the Down-Bars show negative changes.
- Change the color of each of the Up-Bars, Down-Bars, and Start & End columns to colors of your choice. Select No Outline for columns and bars.
- Right-click on each of the Before and After series and select Format Data Series; under Fill & Line, select No line.
- Under Series Options, change Gap Width to 50%. Do the same for the Start & End column series.
- Select the Horizontal axis, right-click and go to Select Data. Select cell C5 to C11 as the Horizontal axis labels.
- Right-click on the horizontal axis and select Format Axis. Under Axis Options -> Labels, choose Low for the Label Position.
- Change Chart Title to “Free Cash Flow.” Remove gridlines and chart borders to clean up the waterfall chart.
Step 3 – Add Data Labels to the Bars and Columns
Recall that we created a column called Data label position; this column will be used to define the position of the labels.
- Right-click on the waterfall chart and go to Select Data. Add a new series using cell I4 as the series name, I5 to I11 as the series values, and C5 to C11 as the horizontal axis labels.
- Right-click on the waterfall chart and select Change Chart Type. Change the chart type of the data label position series to Scatter. Make sure the Secondary Axis box is unchecked.
- Right-click on the scatter plot and select Add Data Labels.
- Right-click on the data labels and go to Format Data Labels. Under Label Options, check the box for Value from Cells and select cells D5 to D11 for the data label range.
- Uncheck other boxes for Label Options. Select Above for Label Positions.
- Right-click on the scatter plot and select No Fill and No Outline to hide the scatter plot.
Step 4 – Insert Connectors Between Each Bar Using Error Bars
- Right-click on the chart and Select Data. Add a new series using cell E5 to E10 as the Series Y Values and type “Connectors” as the series name.
- Click on the Connectors series, click the green plus button on the top right corner of the chart, and check the box for Error Bars.
- Select the Y error bars (vertical bars) and delete them.
- Right-click on the error bars and select Format Error Bars. Under Error Bar Options, select Plus for Direction and No Cap for End Style.
- For Error Amount, select Fixed value and type 1.
- Change the error bars outline to grey color. Right-click on the connector series and select No Color and No Outline to hide the data points.
- Remove the legend to clean up the waterfall chart.
Final Product
Below is a preview of the waterfall chart template. Feel free to use this template to present the results of your financial analyses!
Download CFI’s Free Excel Waterfall Chart Template
Click the button below to download our free Excel Waterfall Chart template!
The following charts can be especially effective for making professional PowerPoint presentations and pitchbooks.
Additional Resources
This is a free Excel Waterfall Chart Template guide. Check out more of our resources to take your Excel skills to the next level:
- Bullet Chart
- List of Excel Formulas and Functions
- Free Excel Course
- Advanced Excel Formulas
- Excel Shortcuts
See all Financial Modeling resources
Article Sources
Excel Tutorial
To master the art of Excel, check out CFI’s Excel Crash Course, which teaches you how to become an Excel power user. Learn the most important formulas, functions, and shortcuts to become confident in your financial analysis.

Launch CFI’s Excel Crash Course now to take your career to the next level and move up the ladder!


