Get Certified for Financial Modeling (FMVA)®
Gain in-demand industry knowledge and hands-on practice that will help you stand out from the competition and become a world-class financial analyst.
Step-by-step guide to build a bullet chart in Excel
The Bullet Chart is one of the best secret weapons of a world-class financial analyst. The Bullet chart can be used as an alternative to the gauge chart and is excellent for use in dashboards, as well as comparing actual results to forecasts. It is one of the most effective types of graphs.
This guide will show you exactly how to build a bullet chart in Excel from scratch.
The first step is to make a table with the information you want to include in the bullet chart. The table must include the following data:
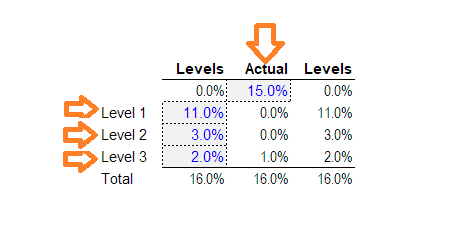
That’s it! If you use our free bullet chart template, the rest of the numbers are calculated for you automatically using formulas.
Take our Free Excel crash course if you want to become a master of Excel.
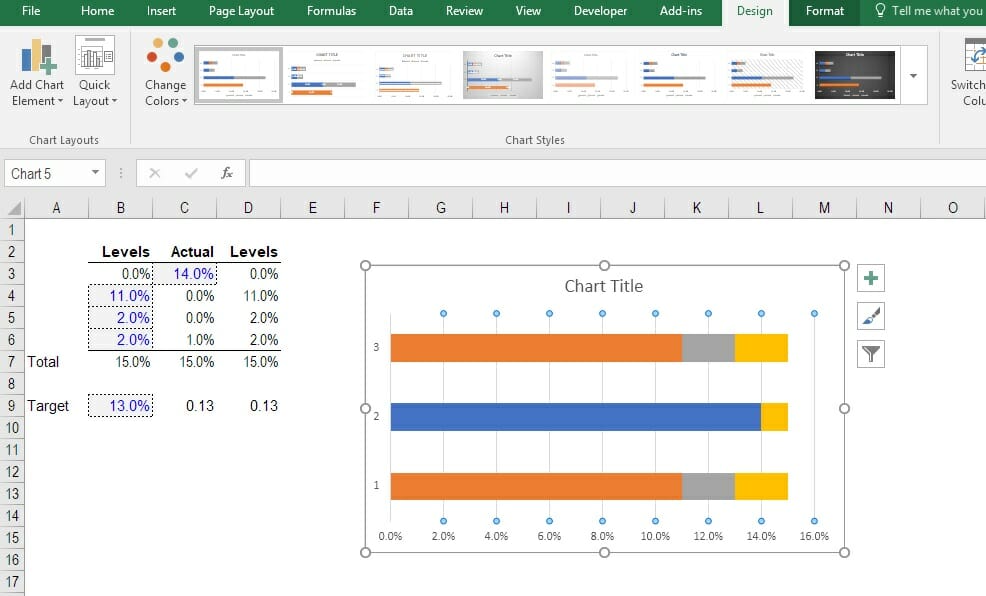
Select the data in the table and then on the Insert tab of the Excel Ribbon choose Stacked Bar (or Stacked Column) to insert a horizontal (vertical) bullet graph.
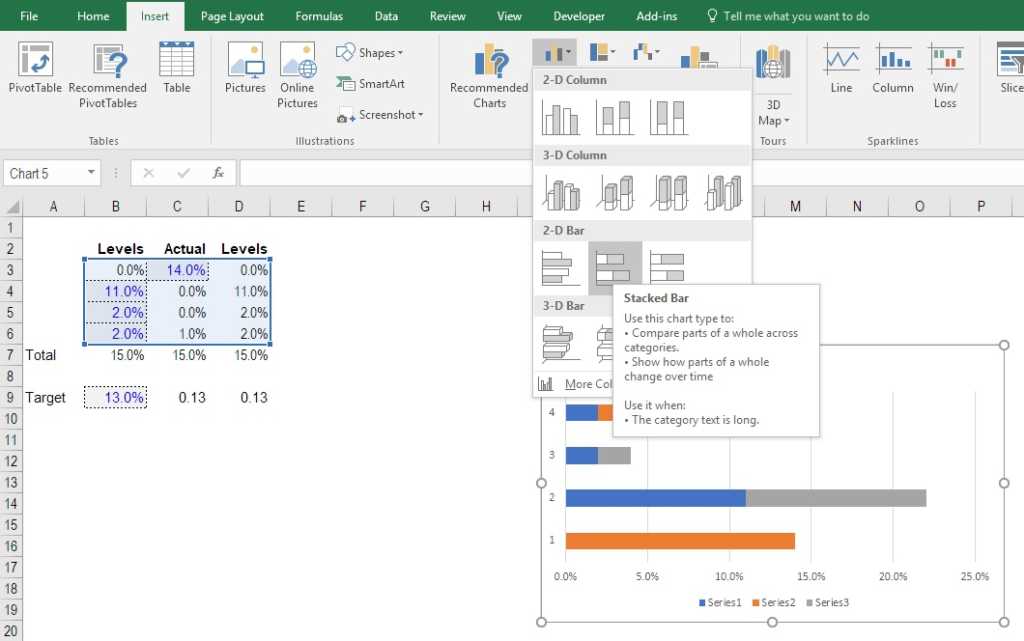
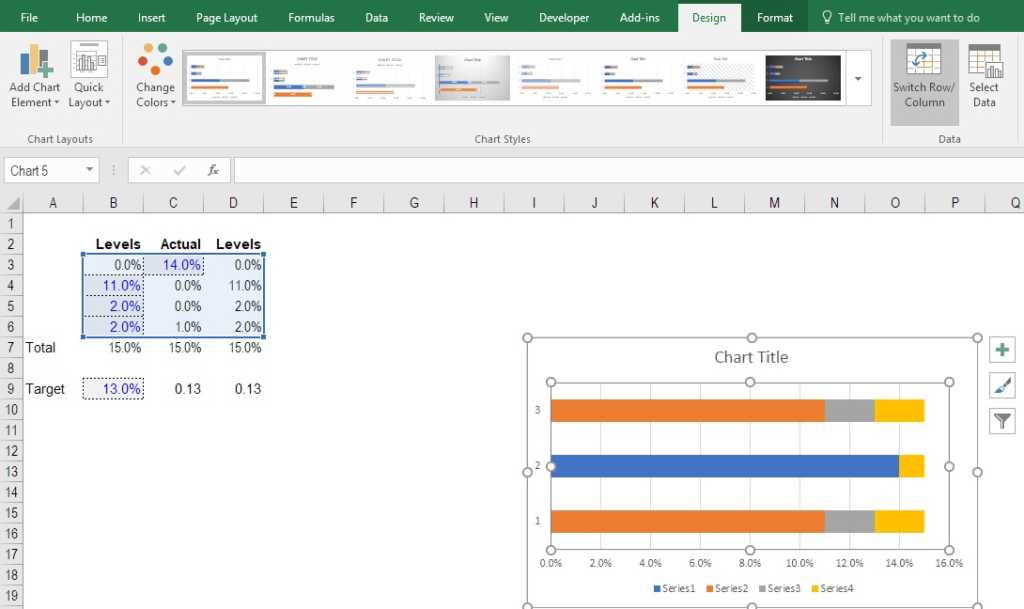
You may need to switch the rows and columns if Excel is not properly detecting the right format. To do this, select the chart, then on the Design tab of the Ribbon, click the button that says “Switch Row/Column”. Ensure your graph looks the same as ours here.
Click on the gridlines of the bullet chart and press the delete key. Next, click on the legend and delete that too. This will make the graph much cleaner.
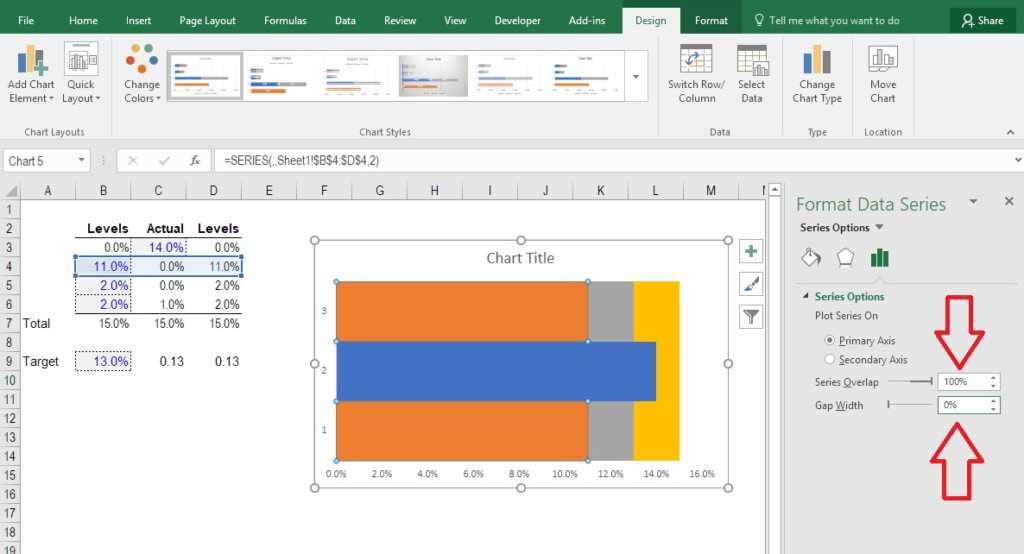
In this step, the bullet graph really starts to take shape. In order to have the “bullet” appear in the center, we need to set the series gap width to zero. In order to do this, right-click on any series and click “format data series”. From there, make sure the series overlap is 100% and the gap width is 0%.
In this step, we can clean up the bullet chart a bit by doing three easy things:
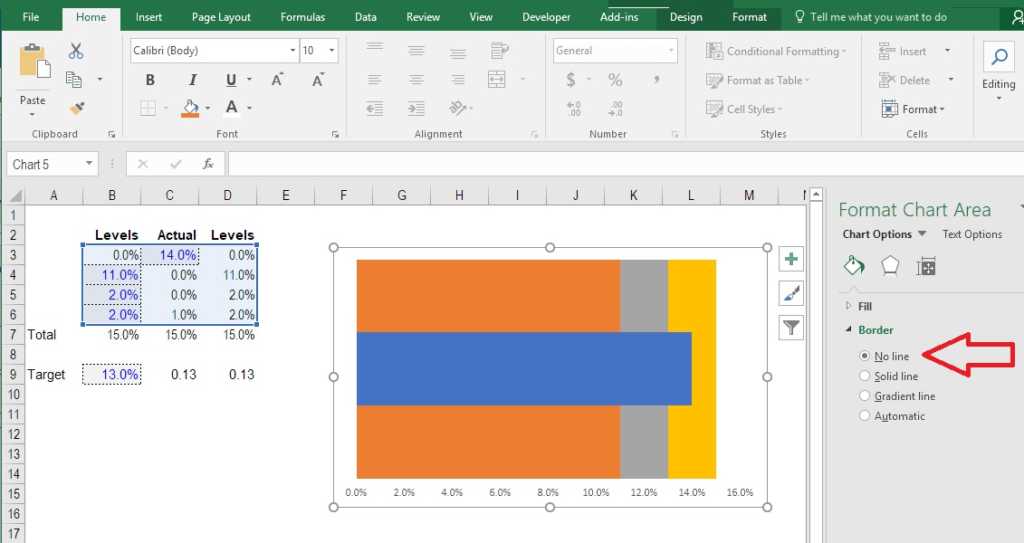
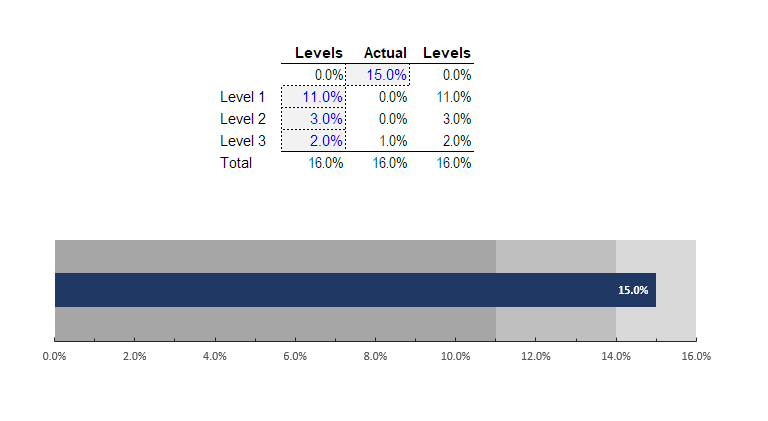
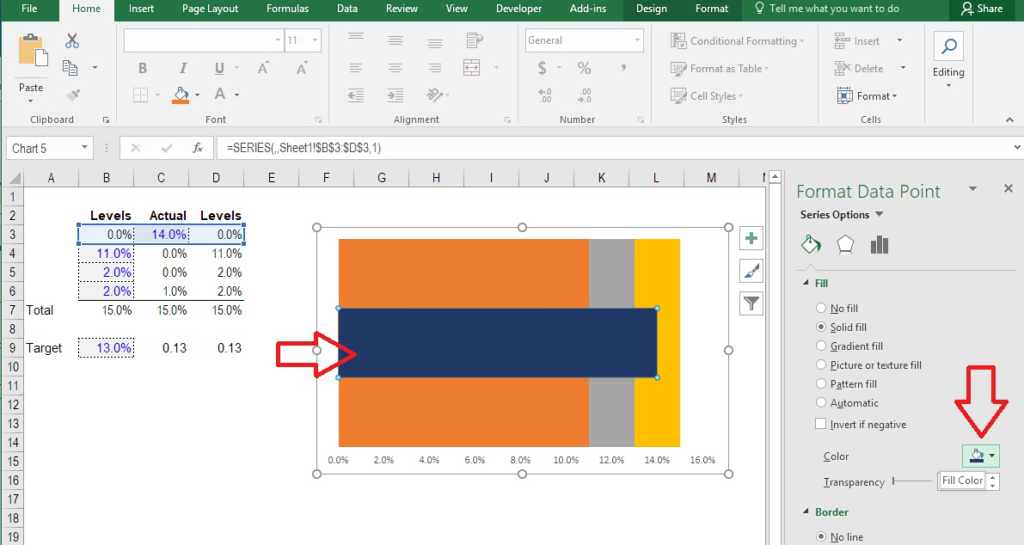
Click on the series with the bullet and then click again on just the bullet data point itself. This will allow you to change the color of only the bullet. Choose a strong color, like dark blue in our example.
Next, select the two data points on either side of the bullet and recolor them a light gray. After that, select each of the series on top and recolor them different shades of gray (or some other light color).
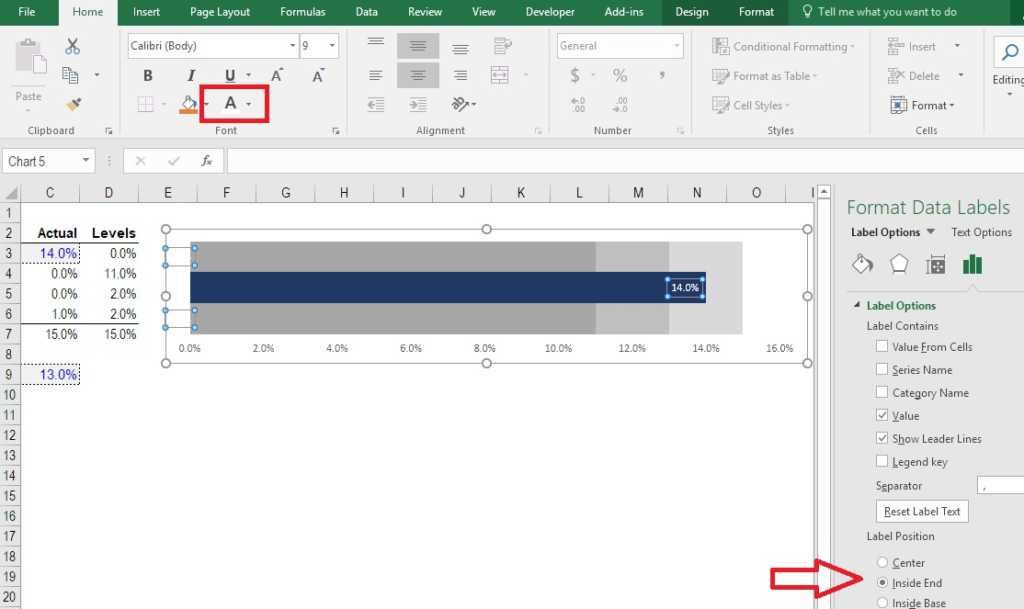
Click on the chart series that contains the bullet, right-click on it, and then choose “add data labels”. Next click the data label, right-click, and format data labels. At this point, you can set it to be a percent, currency, or whatever format you want.
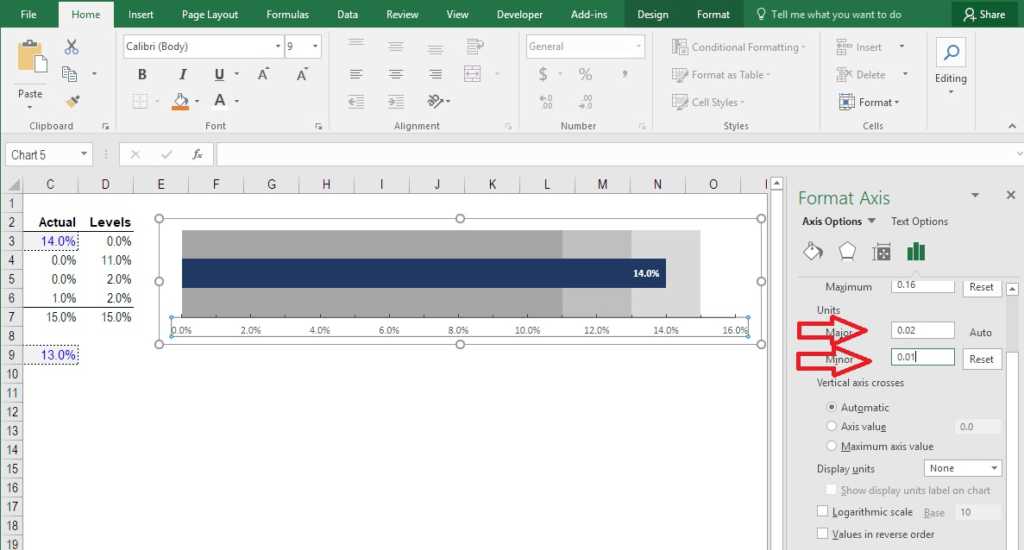
You may want to add tick marks to make the graph more readable. If you want tick marks, like in the example we created, click on the axis, then right-click, format axis, and choose major, minor, or both levels of tick marks.
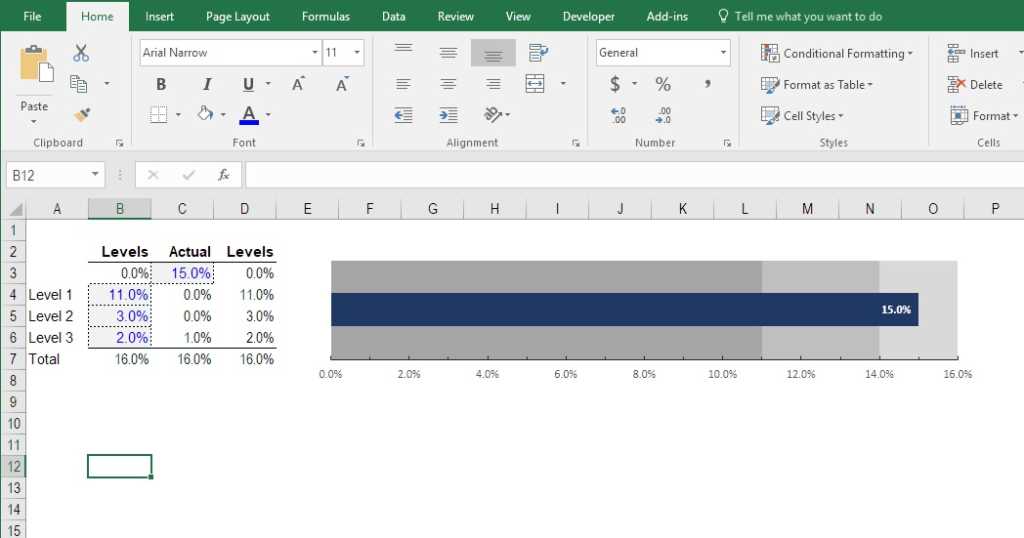
As the last step, you may want to do some final formatting. For example, change the size of the bullet graph, alter the thresholds/levels, modify the major units/tick markets, and final color changes, and make sure it will look great in a presentation or dashboard.
There are some additional elements you may wish to add, such as a single data point for the “target” or an affordance that highlights the gap between actual and target results (variance analysis).
There are some complicated methods of adding this to the chart in Excel, but it’s generally easier to add this information.
Bullet charts are most commonly used in dashboards and executive presentations comparing actual results to a forecast, targets, or some goal. They are great for illustrating progress relative to some criteria for evaluation or measurement of success. Bullet charts are one of the best types of graphs to illustrate results vs a goal.
Click the button below to download our free Bullet Chart template!

To keep developing your skills and become a world-class financial analyst, we highly recommend these additional resources:


