Bullet Chart Template
Bullet Chart Template
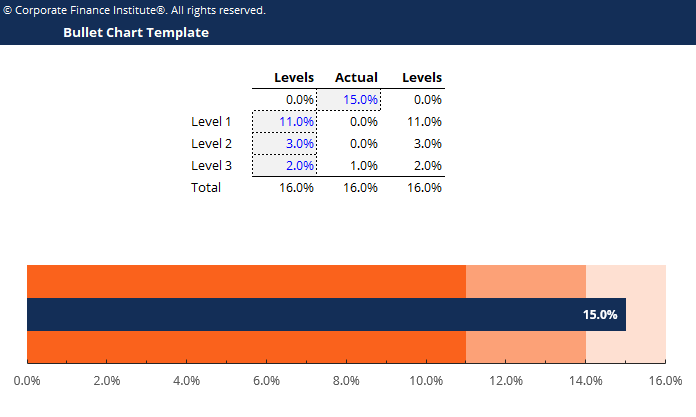
This bullet chart template teaches you how to create a bullet chart from scratch to compare actual versus forecasted performance.
This is what the bullet chart template looks like:
Download the Free Template
Bullet Chart is one of the best secret weapons of a world-class financial analyst. The Bullet graph can be used as an alternative to the gauge chart and is excellent for use in dashboards, as well as comparing actual results to forecast. It is one of the most effective types of graphs.
Steps to Build a Bullet Chart (10-step guide)
Step 1 – Input chart data
Step 2 – Insert Stacked Bar/Column Chart
Step 3 – Switch rows and columns if necessary
Step 4 – Delete gridlines and legend
Step 5 – Set “gap width” to 0%
Step 6 – Format the bullet chart area
Step 7 – Recolor the bullet chart
Step 8 – Add data label (and remove others)
Step 9 – Add tick marks (optional)
Step 10 – Bullet chart finishing touches
More Free Templates
For more resources, check out our business templates library to download numerous free Excel modeling, PowerPoint presentation, and Word document templates.
Analyst Certification FMVA® Program
Below is a break down of subject weightings in the FMVA® financial analyst program. As you can see there is a heavy focus on financial modeling, finance, Excel, business valuation, budgeting/forecasting, PowerPoint presentations, accounting and business strategy.

A well rounded financial analyst possesses all of the above skills!
Additional Questions & Answers
CFI is the global institution behind the financial modeling and valuation analyst FMVA® Designation. CFI is on a mission to enable anyone to be a great financial analyst and have a great career path. In order to help you advance your career, CFI has compiled many resources to assist you along the path.
In order to become a great financial analyst, here are some more questions and answers for you to discover:
- What is Financial Modeling?
- How Do You Build a DCF Model?
- What is Sensitivity Analysis?
- How Do You Value a Business?
Excel Tutorial
To master the art of Excel, check out CFI’s Excel Crash Course, which teaches you how to become an Excel power user. Learn the most important formulas, functions, and shortcuts to become confident in your financial analysis.

Launch CFI’s Excel Crash Course now to take your career to the next level and move up the ladder!


