
Overview
Excel for Data Preparation & Visualization Course
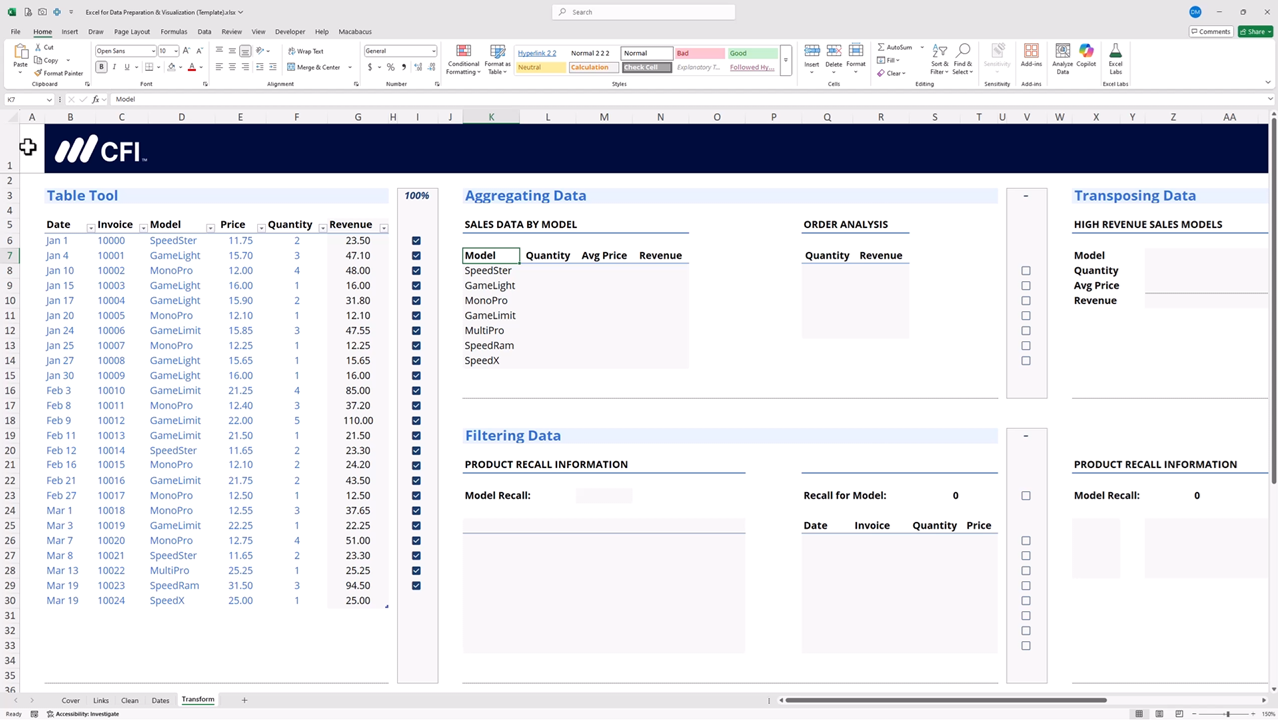
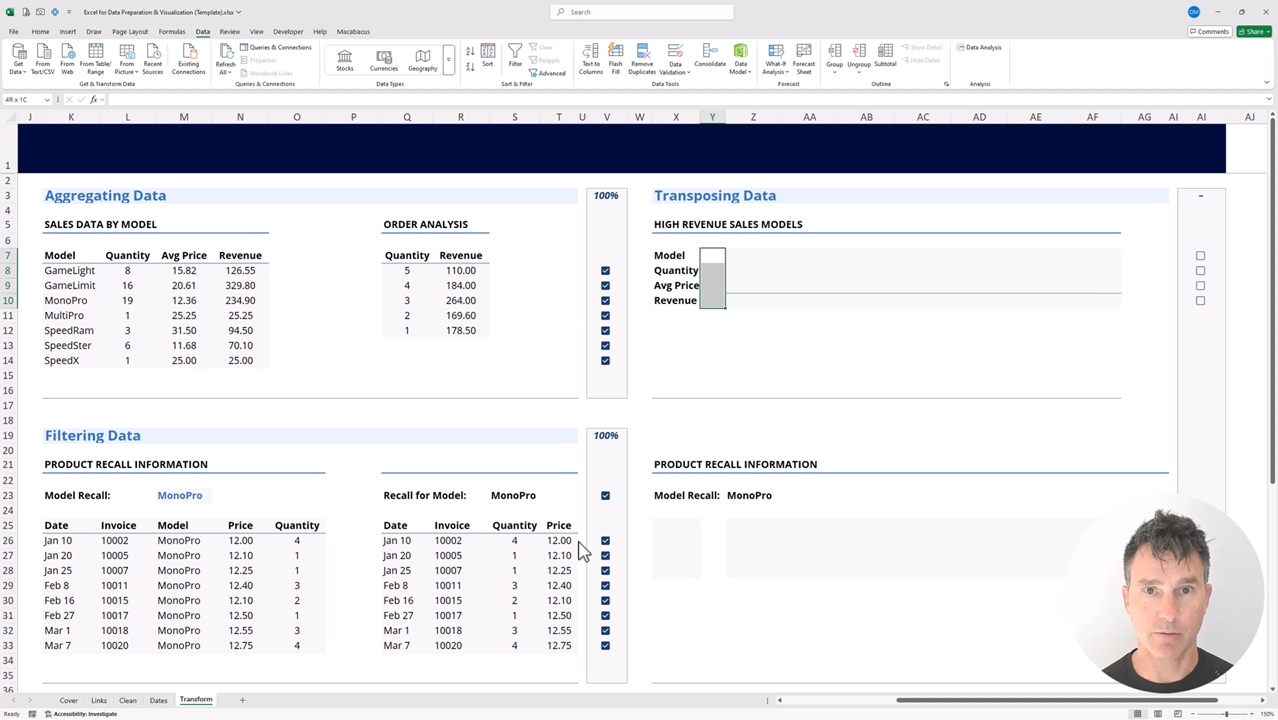
Data preparation is a critical step in any analysis, reporting, or visualization process. Excel remains one of the most widely used tools for the job. In this hands-on course, you’ll learn how to clean, structure, and transform data to prepare it for sharing with key stakeholders through dashboards or other visual outputs. You’ll work directly in Excel to manage workbook links, resolve common data issues (like inconsistent formats and broken dates), and apply transformation techniques such as filtering, aggregating, and transposing data. The course highlights recent Excel capabilities that make these tasks more efficient. You’ll walk away withpractical skills to streamline your workflow and improve data quality.
Who should take this course?
This course is designed for finance, accounting, and business professionals who rely on Excel to prepare, analyze, and visualize data. It supports individuals aiming to strengthen their data handling skills for roles in financial analysis, reporting, and business intelligence.
Excel for Data Preparation & Visualization Learning Objectives
Upon successful completion of this course, learners will be able to:
- Manage workbook links in Excel to consolidate and reference data from multiple files.
- Identify and correct common data issues, including redundant spaces and values not recognized as numbers.
- Parse, reformat, and troubleshoot date fields to ensure proper recognition and usability in Excel.
- Apply transformation techniques such as aggregation, filtering, and transposition to structure data for analysis and visualizations.
Prerequisite Courses
Recommended courses to complete before taking this course.

Level 2
1h 5min
100% online and self-paced
Field of Study: Specialized Knowledge
Start LearningWhat You'll Learn
Course Summary
This Course is Part of the Following Programs
Why stop here? Expand your skills and show your expertise with the professional certifications, specializations, and CPE credits you’re already on your way to earning.
Excel Skills for Professionals
- Skills You’ll Gain Excel, Data Preparation, Data Visualization
- Great For Ideal for business professionals, analysts, and finance specialists who want to strengthen their Excel skills for modeling, data preparation, and reporting.


