Get Certified for
Business Intelligence (BIDA®)
Develop analytical superpowers by learning how to use programming and data analytics tools such as VBA, Python, Tableau, Power BI, Power Query, and more.
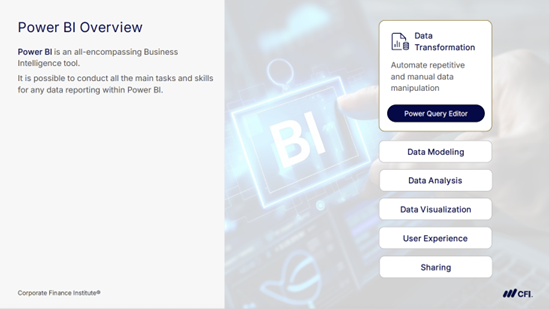
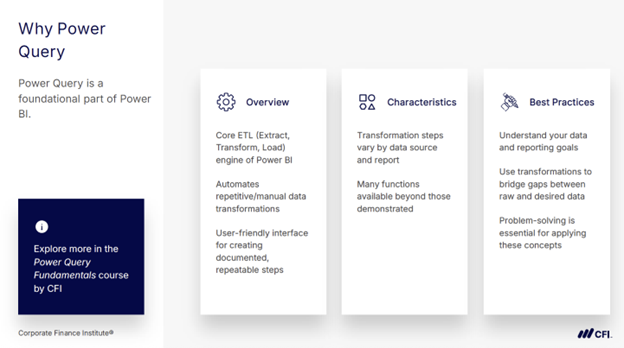
Power Query in Power BI is a data transformation engine that lets users connect various data sources, reshape data, and load cleaned data into Power BI for analysis. Power BI uses Power Query as the key component for its ETL (Extract, Transform, Load) tool.
Power Query Editor is the workspace inside Power BI where you interactively clean and shape data. You can transform data in various ways, such as removing extra rows, splitting combined columns, or changing data types. Once the data is cleaned, you can load it for analysis and visualization in Power BI.
(Note: Power Query also remains a default plugin to Excel, where it lets you load and prepare data for spreadsheets and create charts, graphs, and dashboards.)
The Power Query Editor is the workspace within Power BI where you interactively clean and shape data using Power Query. It acts like a staging area: you refine your raw data here before loading it into the main Power BI model for analysis and visualization.
Here’s a closer look at what the Power Query Editor offers:
When you click “Transform Data” in Power BI Desktop, the Power Query Editor opens. This is a separate window with tools to manage all your data transformation tasks.
You’ll see a sample preview of your dataset, not the full data. This allows you to experiment with transformations quickly without overloading your computer.
On the right-hand side, every transformation you make, such as filtering rows, changing data types, splitting columns, or merging tables, appears as a list of Applied Steps.
On the left, you’ll see all your queries (datasets or tables you’re working on). You can rename them, duplicate them, or reference them in new transformations.
Across the top, the ribbon gives you commands grouped under tabs (Home, Transform, Add Column, View). These let you quickly do things like:
Although most tasks are point-and-click, every action you perform is translated into M code, Power Query’s underlying programming language, in the background. If you need more control, you can open the Advanced Editor to directly edit this script.
Power Query automates data transformation by recording each action as a step and replaying those steps every time the data is refreshed.
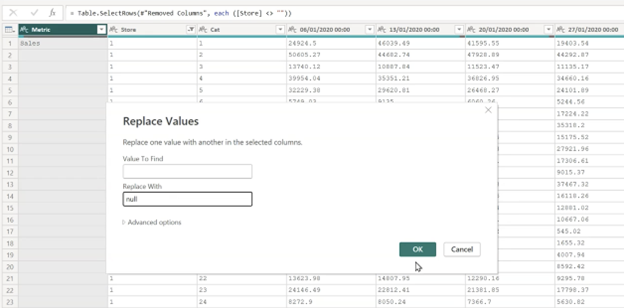
Every transformation you apply in Power Query is saved in the Applied Steps pane. Actions like replacing values, splitting columns, or merging queries are stored in sequence. When the dataset is refreshed, Power Query automatically replays each step in the order it was created.
Think of it like recording a macro in Excel, but far more powerful and easier to edit. Instead of redoing the same cleaning tasks over and over, Power Query locks each transformation into place so it can run again automatically.
Automating transformations in Power Query helps to reduce repetitive manual work and prevent errors. Imagine monthly sales reports arriving from multiple stores. Without automation, you might spend hours copying, pasting, and fixing formats. With Power Query, you define the cleaning rules once, and every new file is transformed instantly.
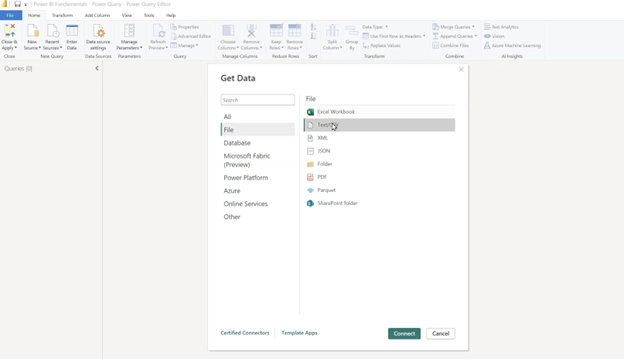
You can import data into Power Query by connecting to a source, previewing the data, and opening it in the Power Query Editor for transformation. The interface is consistent across sources, which makes it easier to apply the same process whether you’re working with flat files, folders, or other systems.
One of the most common use cases is loading CSV files. You select the file, review it in the Navigator, and then bring it into the Power Query Editor. From there, you can promote headers, filter out unnecessary rows, and set the correct data types.
CSV imports are often used for exports of transactions, sales data, or payroll records. Power Query remembers every cleaning step, so the same transformations apply each time you refresh.
Power Query can also connect to a folder. This allows you to load multiple files at once, such as monthly reports stored in a shared location. Instead of cleaning each file manually, you apply a single set of transformations across the entire folder.
For example, if you have multiple CSV files representing several years of monthly sales, you can connect to the folder, define the transformations once, and every file will be processed automatically. New files added later will also be included as soon as you refresh the query.
No matter what source you connect to, the import process feels familiar. The ribbon, preview pane, and transformation tools work the same way whether you load a single CSV, a folder, or another structured data source.
This consistent experience makes Power Query easier to learn and reduces errors when working across multiple projects. It also builds confidence, since you know the process won’t change depending on where the data comes from.
The Power Query Editor in Power BI is built to help you clean, reshape, and combine data before analysis. Most Power Query transformations fall into a few broad categories:
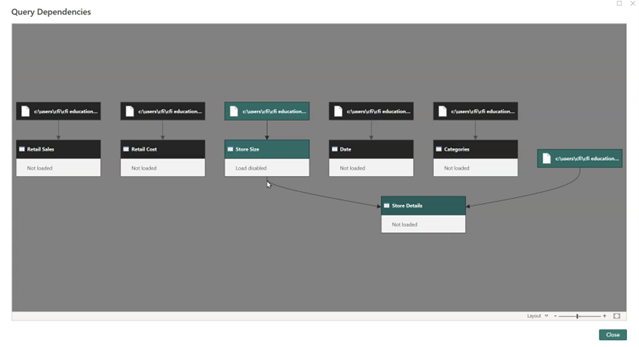
Within the Power Query Editor, Query Dependencies lets you organize and name queries. This feature helps you understand how different tables connect and keep your workspace structured as projects grow.
For example, you might see CSV and Excel sources connected to queries such as “Retail Sales” and “Retail Costs,” with “Store Size” merging into “Store Details.” The Query Dependencies view helps you confirm data lineage, spot redundant queries, and trace where errors might occur if a source or query breaks.
Power Query in Power BI prepares raw data for analysis by automating cleaning and transformation, ensuring datasets are accurate and consistent. It handles importing, reshaping, and structuring so data is ready for modeling and visualization. Power Query saves time on repetitive data preparation and ensures reliable results for analysis and reporting in Power BI.
Power Query is used to connect, clean, and transform raw data before it’s loaded into Power BI for analysis. Typical use cases include cleaning monthly sales exports, preparing cost data, and reshaping spreadsheets into a usable structure.
Select the columns, right-click, and choose Unpivot Columns. This reshapes multiple column headers into row values for easier reporting. For example, a table with twelve monthly sales columns can be unpivoted into two columns: Month and Sales.
Yes. You can connect to a folder and use a custom function to apply the same cleaning steps to every file automatically. This is especially useful when consolidating recurring reports, such as monthly sales or payroll files, into one dataset.
CFI’s Data Analysis in Power BI course equips you with the practical skills to transform data, structure it for models, and create visuals that bring clarity to your insights. You’ll learn how to work with data more efficiently and share analytical findings with confidence.
Discover how you can leverage Power BI to transform raw data into clear, actionable insights.
Explore Data Analysis in Power BI


