What Does a Financial Analyst Do
What the life of an analyst is really like
Over 1.8 million professionals use CFI to learn accounting, financial analysis, modeling and more. Start with a free account to explore 20+ always-free courses and hundreds of finance templates and cheat sheets.
What Does a Financial Analyst Do? A Day in the Life
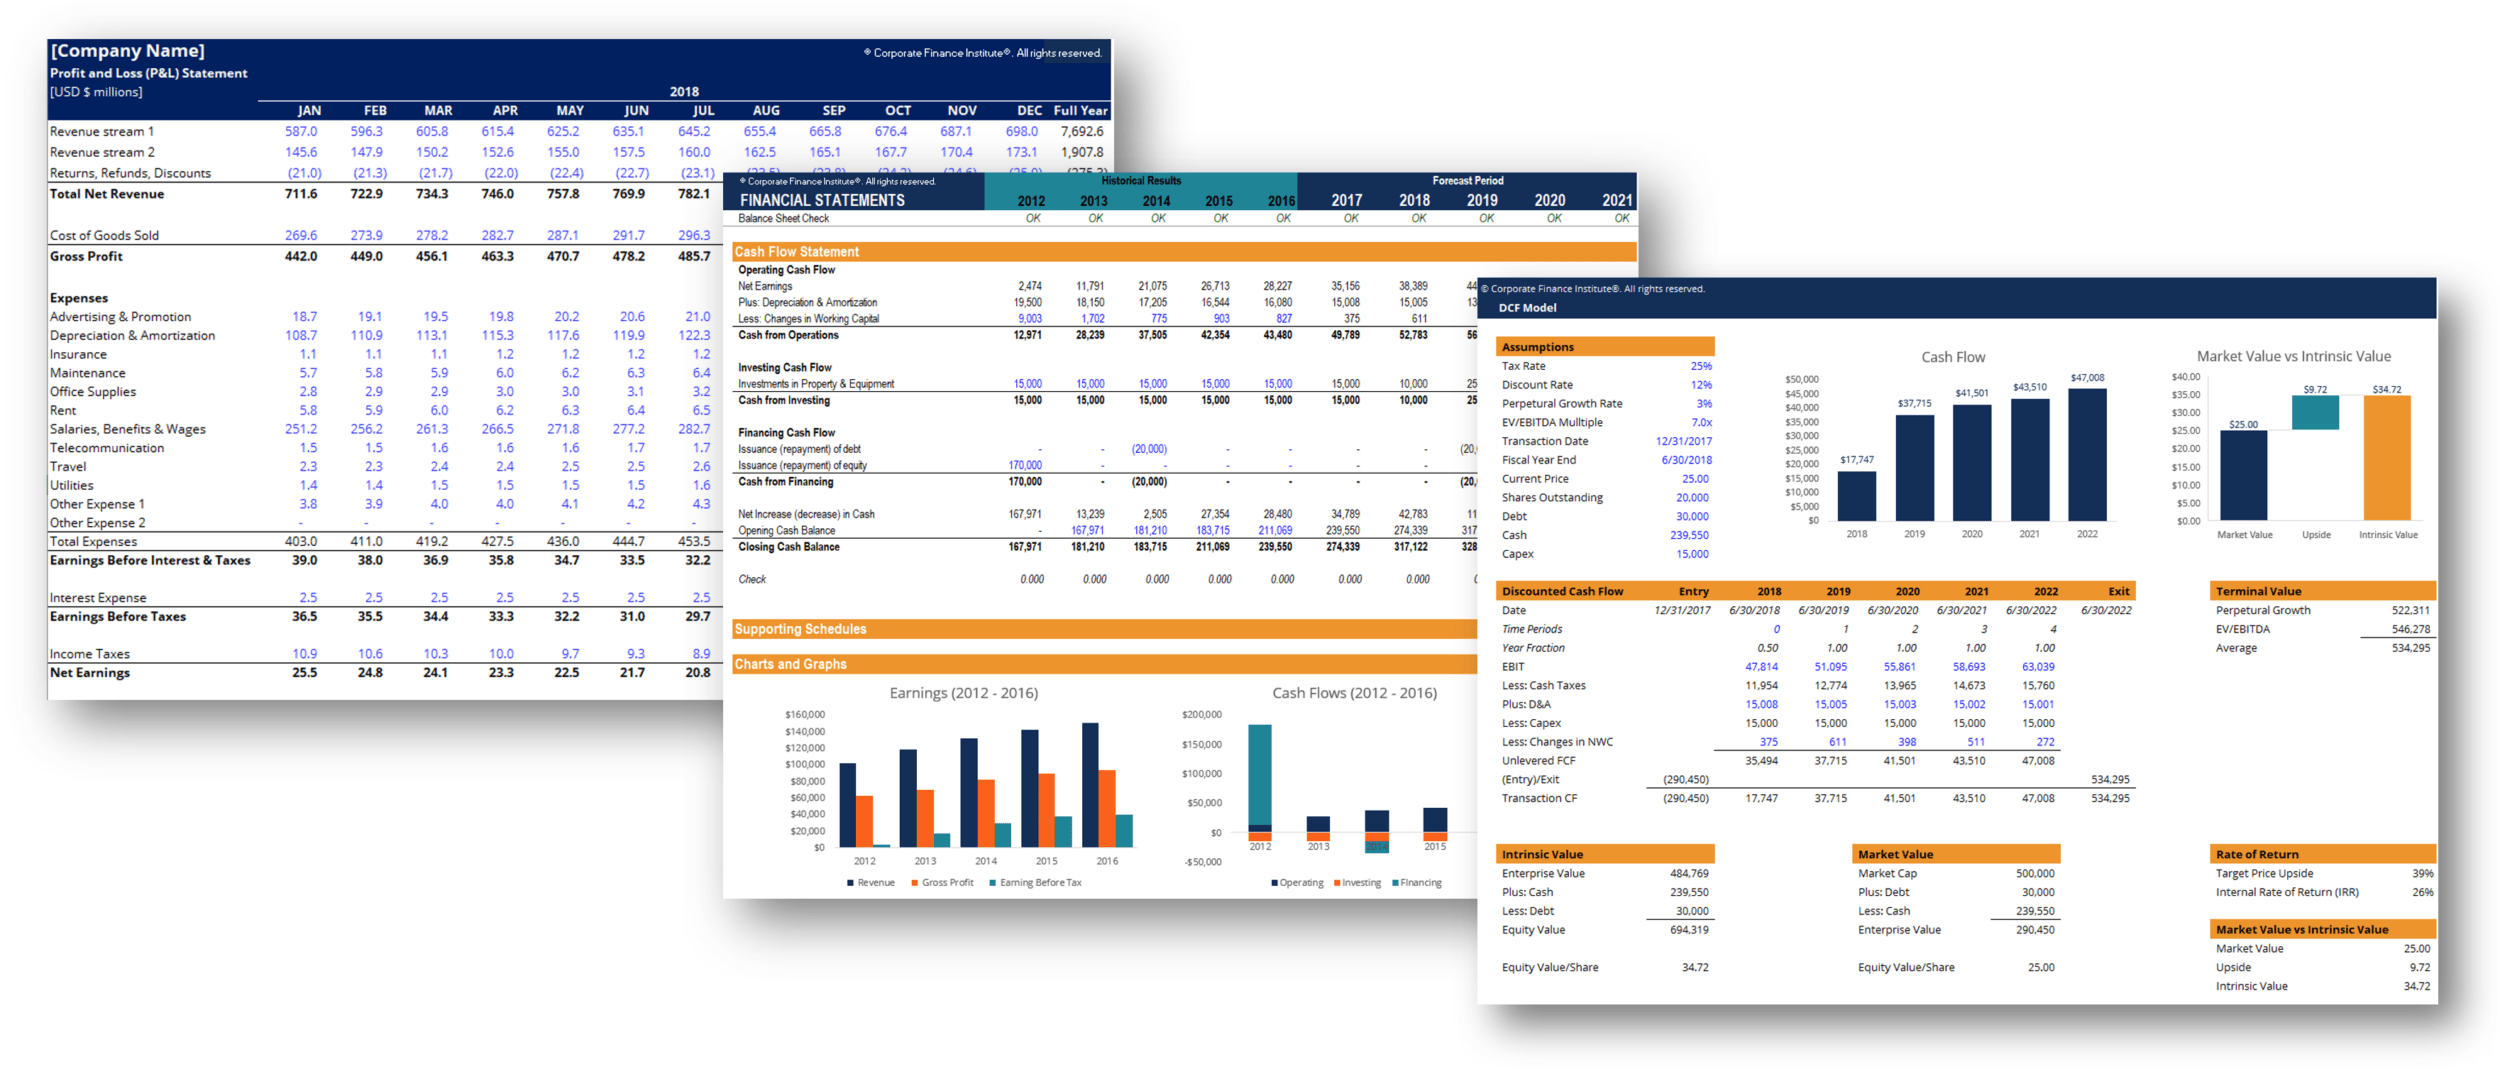
A financial analyst is responsible for a wide range of activities including gathering data, organizing information, analyzing historical results, making forecasts and projections, making recommendations, and generating Excel models, presentations, and reports. This guide will provide a detailed breakdown of a day in the life of a financial analyst, and answer the question, what does a financial analyst do?

To learn more about the real day-to-day life of an analyst, check out CFI’s Online Financial Analyst Courses, as they provide complete training on all of the most important skills that are required for the job.
List of What a Financial Analyst Does
Analysts have many duties and responsibilities, depending on the organization they work for, the industry they are in, and their seniority. Below is a list of the most common things they do:
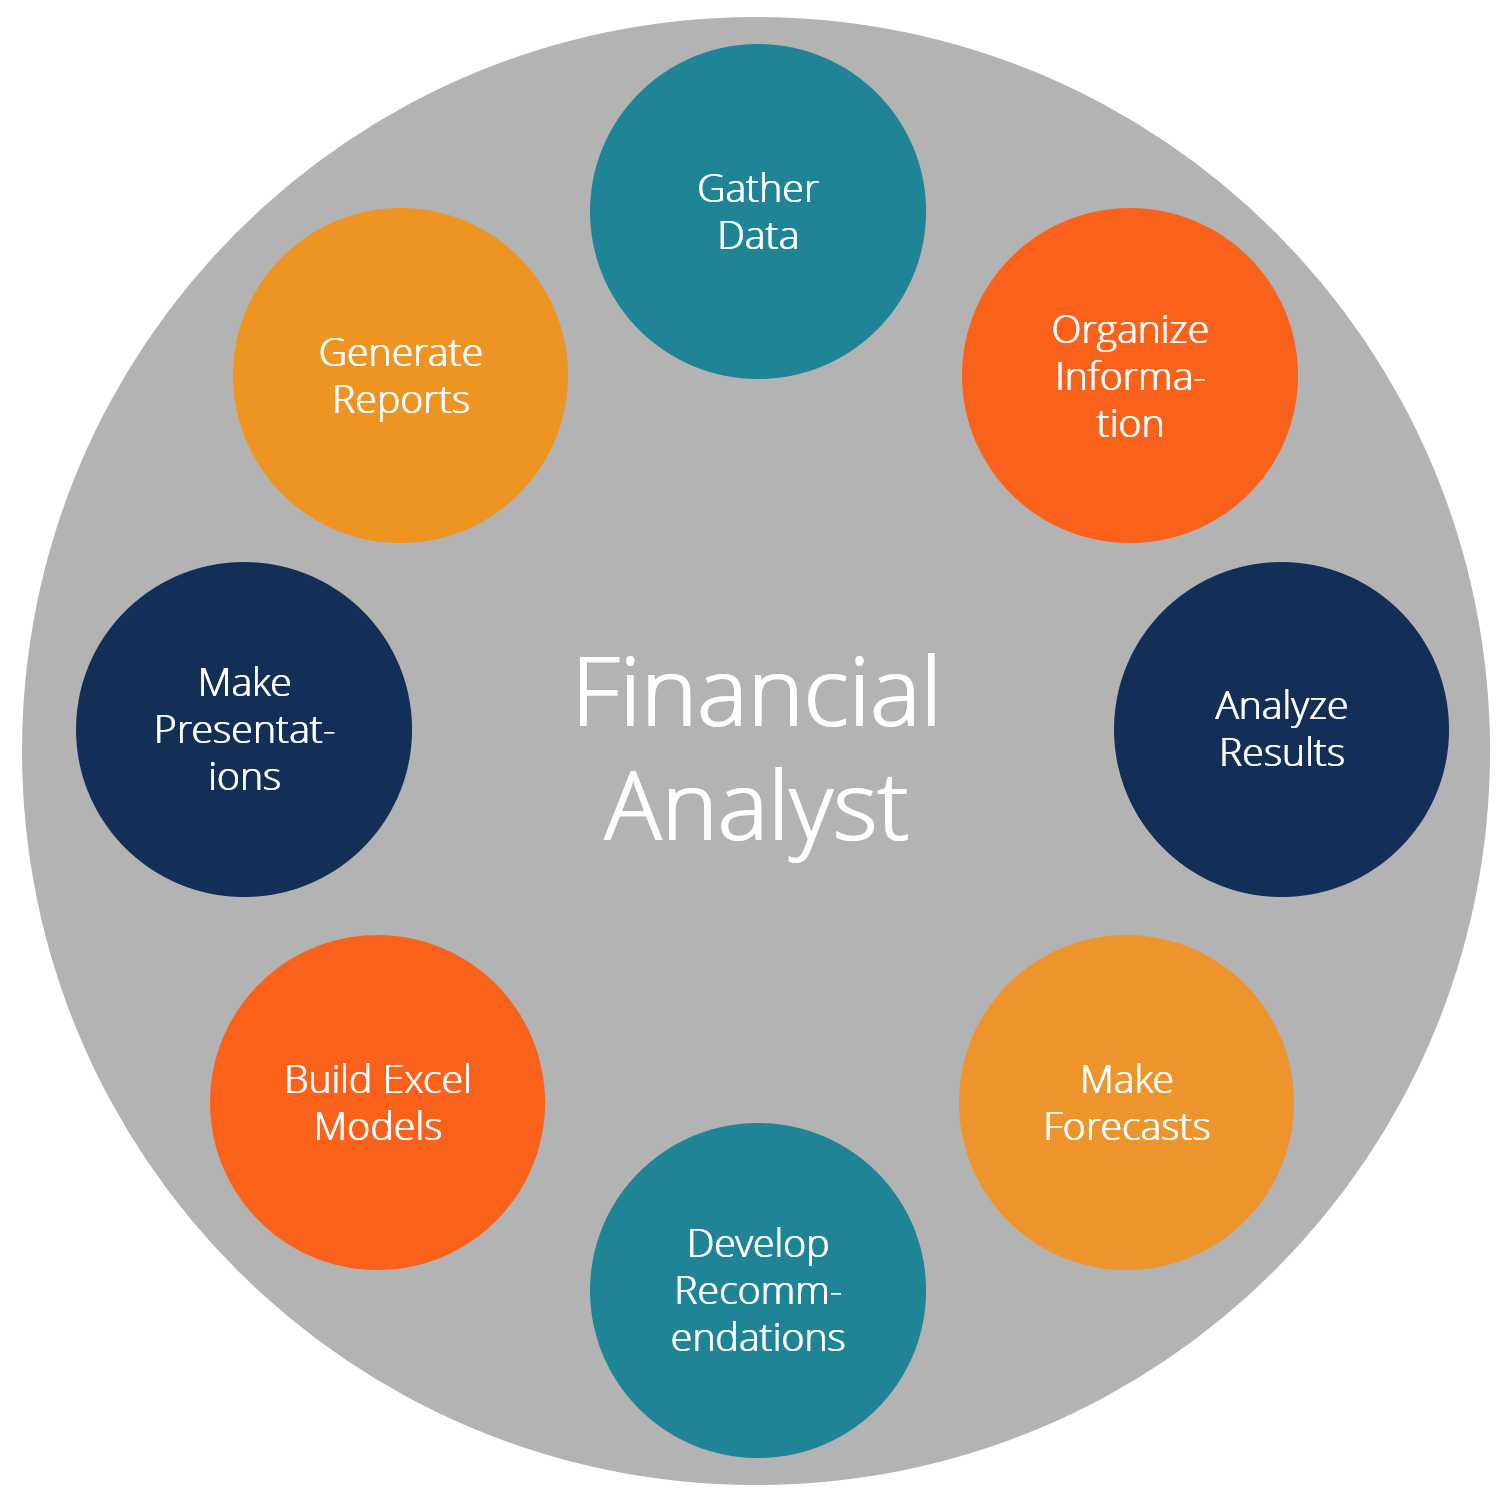
#1 Gather data and information
The work of a financial analyst starts with gathering data and information about whatever they need to analyze. Examples include historical financial reports, accounting data from the general ledger, stock price information, statistics and macroeconomic data, industry research, and just about any other type of quantitative data. The information will be gathered from sources such as the company’s internal databases, third-party providers such as Bloomberg or Capital IQ, and government agencies such as the Securities and Exchange Commission (SEC).
#2 Organize information
Once the data is gathered it’s typically entered into Excel or some other type of database. Once inputted, the next task is to organize it, clean it up, and get it into a format it can be made sense of. This typically means sorting the numbers by data, or by category, adding formulas and functions to make sure it’s dynamic, and using consistent formatting styles so that it’s easy to read and understand. See more Excel formatting tips.
#3 Analyze financial results
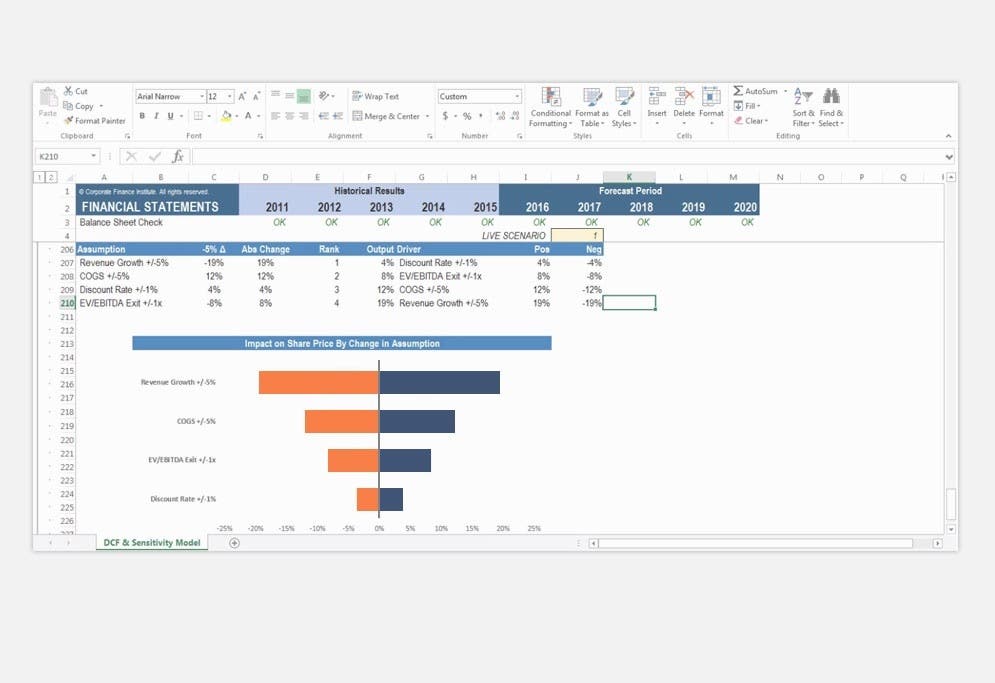
With the data all cleaned up and organized in Excel, it’s time for the financial analyst to start analyzing past information and historical results. This typically includes looking at ratios and metrics like gross margin, net margin, fixed vs. variable costs, year-over-year (YoY) growth rates, return on equity (ROE), return on assets (ROA), debt/equity ratio, earnings per share (EPS), and many others. The analyst will look for trends and benchmark the performance against other companies in the same industry. When asking what does a financial analyst do, this is one of the biggest components!
#4 Make forecasts and projections
Now that historical information has been analyzed, it’s time to make projects and forecasts about how the company will perform in the future. There is both an art and a science to predict how a company will perform, and many assumptions and even leaps of faith have to be made. Common forecasting methods include regression analysis, year-over-year growth rates, as well as bottom-up and top-down approaches. Learn more in CFI’s Budgeting and Forecasting Course.
#5 Develop recommendations
A good financial analyst is not only good with numbers but actually generates insights and recommendations on how to improve the operations of a business. Examples of helpful recommendations and insights include ways to cut costs, opportunities to grow revenue, ways to increase market share, operational efficiencies, customer satisfaction, and much more. This is what truly separates a world-class financial analyst from the rest. These recommendations will be presented to the CEO, the CFO, other executives, and/or the board of directors.
#6 Build Excel models
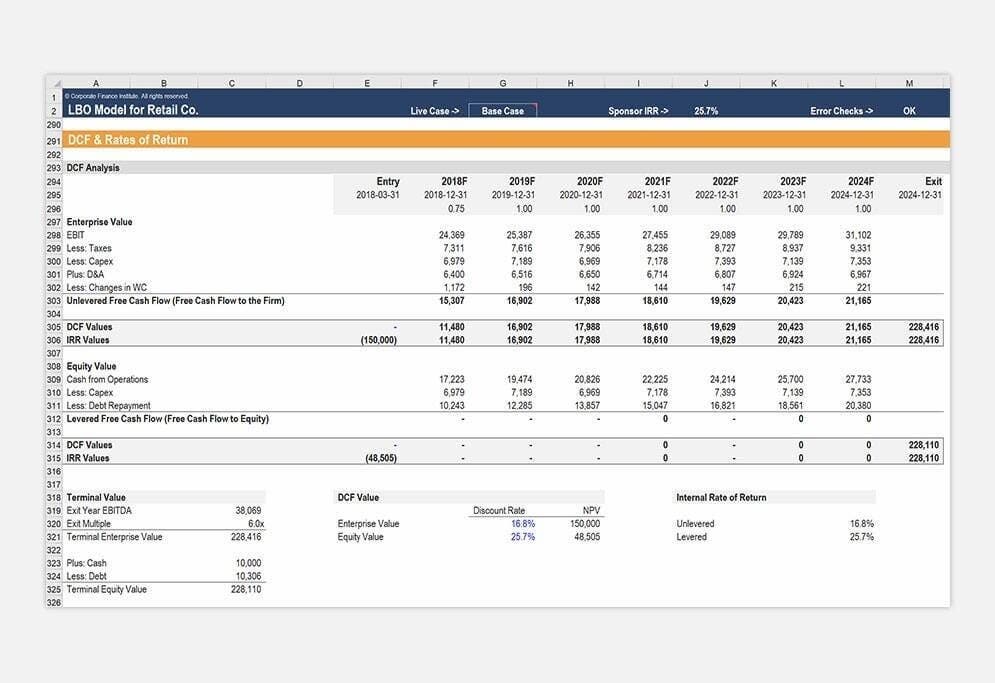
For analysts working in investment banking, equity research, corporate development, financial planning & analysis (FP&A), and other areas of corporate finance, financial modeling will be a big part of the job. These models typically start by linking the 3 financial statements and then layering on more advanced types of financial models such as discounted cash flow analysis (DCF models), internal planning models, and more arcane models such as LBO models and M&A models.
Learn more about these in CFI’s Financial Modeling Courses.
Image from CFI’s Financial Analyst Courses.
#7 Make presentations
When someone asks, what does a financial analyst do, the answer will always include something to do with making presentations (often in PowerPoint). The analysis that’s completed in Excel then has to be turned into charts and graphs, which can then be inserted into pitchbooks and management presentations. Learn more in CFI’s PowerPoint Presentations Course.
#8 Generate reports
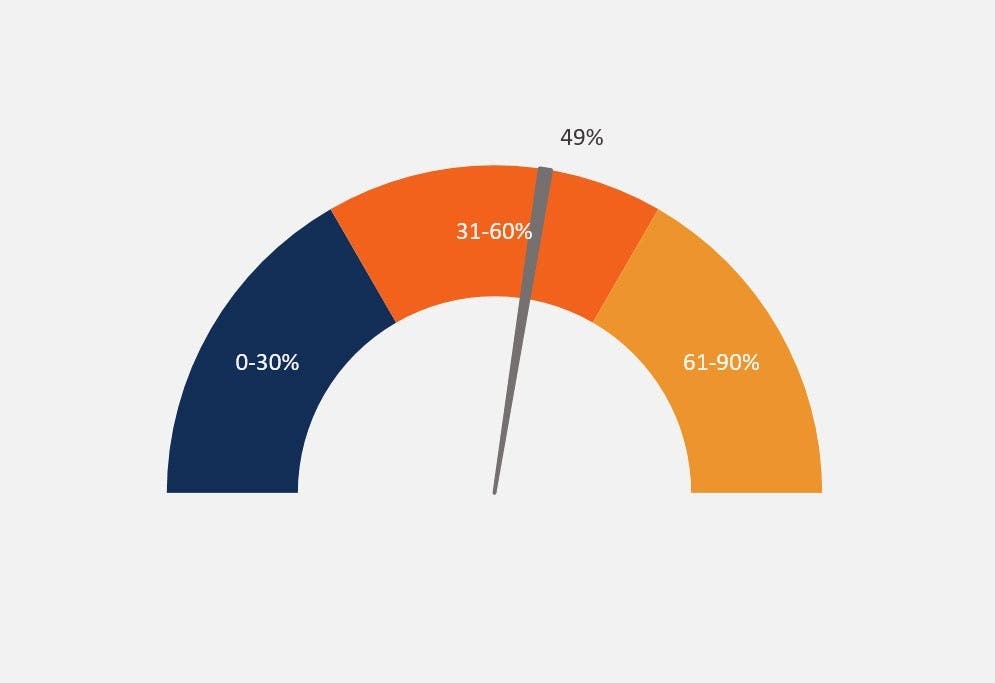
Internal reports and dashboards are a part of the daily life of an analyst. Whether it’s presenting key performance indicators (KPIs) or tracking actual vs. budgeted results, it’s imperative to the company or the client that information be clearly presented, timely, easy to understand, accurate, and insightful. To learn more, check out CFI’s Dashboards Course.
Types of Financial Analysts
Below is a list of the most common types of financial analysts:
- Investment banking analyst
- Equity research analyst
- Treasury analyst
- Financial planning and analysis (FP&A) analyst
- Private equity analyst
- Corporate development analyst
A Day in the Life of a Financial Analyst
Below is an example of a day in the life of a financial analyst working at a corporation on the FP&A team:
7:00 am – At home, check phone and email for any important messages before getting ready for work and commuting to the office.
8:30 am – Arrive at the office, respond to any urgent emails, follow-up on any outstanding items from the previous day.
9:00 am – Finance team meeting to discuss changes that need to be made to the Q4-2018 budget model, including updates to assumptions and changes to forecast.
10:00 am – Work on the budget model and make all updates and changes that were discussed in the meeting.
12:30 pm – Pick up lunch from a nearby deli and eat back at the desk while catching up on financial news and videos on Bloomberg.com.
1:30 pm – Start working on the updated version of the Q4 board presentation including updated PPT slides and graphs in Excel.
4:30 pm – Circle up with the manager and review changes to the budget model as well as the board presentation.
5:30 pm – Tend to some personal errands and respond to emails from friends.
6:00 pm – Finish up changes from the 4:30 pm meeting with the manager and finalize the Excel model and PPT presentation.
7:00 pm – Head out of the office and meet some friends for dinner or head home.
Note: a day in the life can vary significantly depending on the industry, city, and the particular day. The above is meant to represent an average day for a corporate analyst. Other types of analysts, like those in investment banking, will work much longer hours.
Additional Resources
Thank you for reading this guide to better understand what does a financial analyst do. CFI is the official provider of the Financial Modeling & Valuation Analyst (FMVA)™ certification program, designed to help anyone in that role become world-class at their job. Additional resources to help you on your way include:
Create a free account to unlock this Template
Access and download collection of free Templates to help power your productivity and performance.
Already have an account? Log in
Supercharge your skills with Premium Templates
Take your learning and productivity to the next level with our Premium Templates.
Upgrading to a paid membership gives you access to our extensive collection of plug-and-play Templates designed to power your performance—as well as CFI's full course catalog and accredited Certification Programs.
Already have a Self-Study or Full-Immersion membership? Log in
Access Exclusive Templates
Gain unlimited access to more than 250 productivity Templates, CFI's full course catalog and accredited Certification Programs, hundreds of resources, expert reviews and support, the chance to work with real-world finance and research tools, and more.
Already have a Full-Immersion membership? Log in
