Get Certified for
Capital Markets (CMSA®)
From equities and fixed income to derivatives, the CMSA certification bridges the gap from where you are now to where you want to be — a world-class capital markets analyst.
An indication of a possible impending reversal in price action to the downside
A shooting star is a specific technical analysis formation or pattern that occurs in candlestick charting. It is interpreted as signaling an impending bearish reversal to the downside.
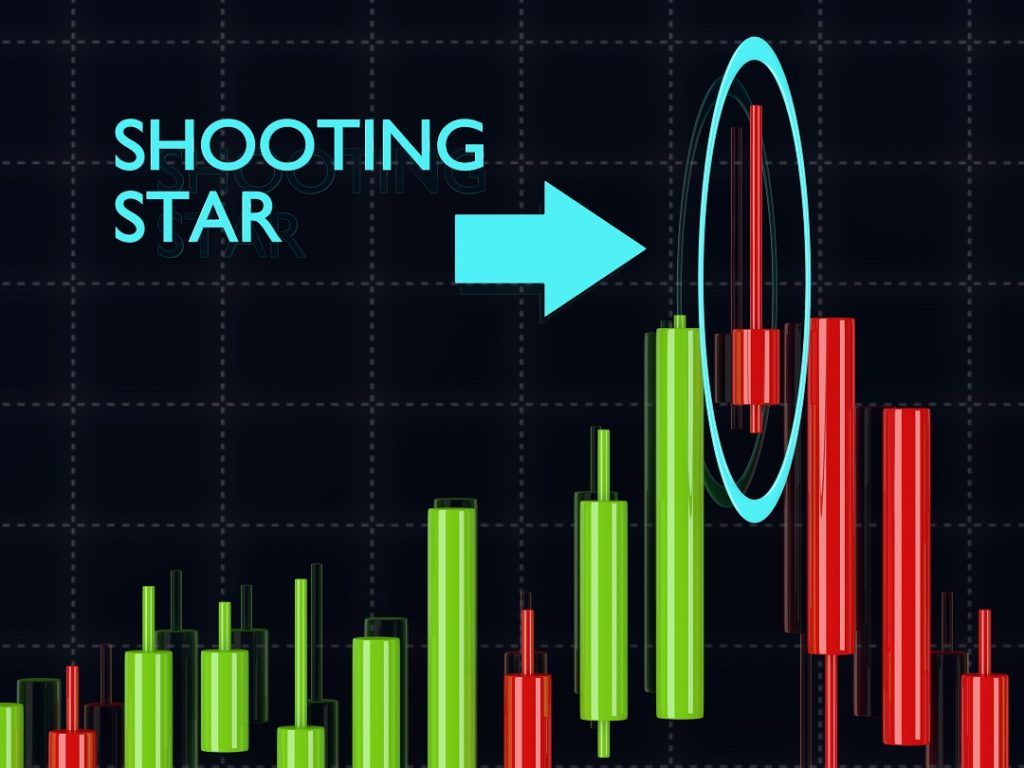
To be properly interpreted, a shooting star formation is only considered valid when it occurs following a recognizable uptrend of some duration and when it occurs at or near the highest price in recent market action.
The shooting star pattern is just one of many signals of potential market reversals recognized in candlestick charting. Other reversal patterns include engulfing candles, the hanging man pattern, and doji candlestick formations.
As with all candlestick patterns, a shooting star must be correctly identified to be of use to traders. The key characteristics of a shooting star candlestick are as follows:
Additionally, there are some characteristics of a shooting star formation that, if they occur, make the signal of a possible market reversal to the downside stronger. The first of the traits is the closing price. A price close that is below the opening price, indicating that price moved net to the downside for the time frame covered by the candlestick, makes for a stronger shooting star pattern. The pattern is also considered stronger if there is no lower tail or shadow whatsoever.
If the candlestick’s closing price is below the opening price, and there is no lower tail extending below the candlestick body, that shows that price closed at the very lowest price traded during the duration of the candlestick, and this is considered an additionally bearish signal.
Another strong indication of an impending bearish reversal is when the candlestick’s upper shadow is much longer than the candlestick body – three or four times longer, or more. It indicates that although the price traded significantly higher during the time frame the candlestick reflects, higher prices were strongly rejected as sellers entered the market and buyers exited, eventually driving price sharply lower to end the time period and form the shooting star pattern.
To learn more about candlestick patterns, check out CFI’s Trading Using Technical Analysis course!
A 15-minute chart of GBP/USD in the forex market is shown below, illustrating an instance of the shooting star formation occurring and correctly presaging a turn to the downside.

In approximately the center of the chart, you can see a strong, sustained up move in GBP/USD. Several candlesticks show the currency pair moving sharply higher, but then a candlestick (the one that occurs between the two red arrows pointing down) forms a shooting star pattern. There is a long upper tail or upper shadow, a comparatively much shorter lower tail or shadow, and a noticeably short body with the price closing below the candle’s opening price.
In such an instance, the shooting star formation was correct in its prediction. The price takes a sharp dip to the downside over the time frame of the next three candlesticks that form before resuming the overall trend to the upside. A trader who sold short upon seeing the shooting star pattern could’ve quickly pocketed a profit on a short-term, intraday trade.
In this case, the shooting star signaled what turned out to be only a short-term reversal. However, the pattern sometimes indicates a long-term reversal from an overall uptrend to an overall downtrend.
CFI is the official provider of the global Capital Markets & Securities Analyst (CMSA)® certification program, designed to help anyone become a world-class financial analyst. To keep advancing your career, the additional CFI resources below will be useful:


