Revenue Variance Analysis Template
Over 2.8 million + professionals use CFI to learn accounting, financial analysis, modeling and more. Unlock the essentials of corporate finance with our free resources and get an exclusive sneak peek at the first module of each course.
Revenue Variance Analysis Template
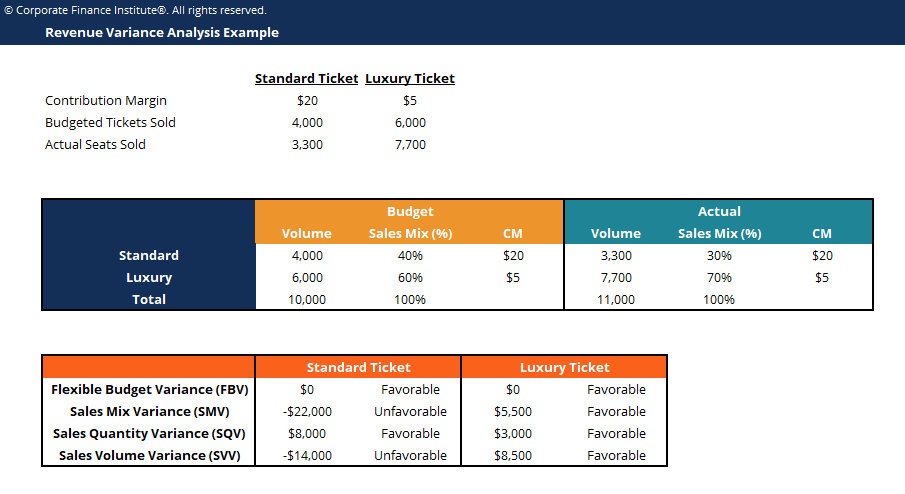
This revenue variance analysis template demonstrates how to use the column-based approach to calculate the three different types of revenue variance.
This is what the revenue variance analysis template looks like:
Download the Free Excel Template
Revenue Variance Analysis is used to measure differences between actual sales and expected sales based on sales volume metrics, sales mix metrics, and contribution margin calculations. Information obtained from Revenue Variance Analysis is important to organizations because it allows management to determine actual sales performance in relation to the perceived performance of the company for specific products. It helps businesses identify which products are performing better in the market. Overall, variance analysis helps management make better strategic and business-level decisions to maximize its profitability.
| Flexible Budget Variance (FBV) | Sales Mix Variance (SMV) | Sales Quantity Variance (SQV) |
|---|---|---|
| Difference between the actual contribution margin and the standard contribution with sales mix and sales volume held constant | Difference between the actual product mix and the standard product mix with sales volume and contribution margin held constant | Difference between the actual volume of sales and the standard (estimated) volume of sales with sales mix and contribution margin held constant |
More Free Templates
For more resources, check out our business templates library to download numerous free Excel modeling, PowerPoint presentation, and Word document templates.
Excel Tutorial
To master the art of Excel, check out CFI’s Excel Crash Course, which teaches you how to become an Excel power user. Learn the most important formulas, functions, and shortcuts to become confident in your financial analysis.

Launch CFI’s Excel Crash Course now to take your career to the next level and move up the ladder!
0 search results for ‘’
People also search for:
excel
power bi
esg
accounting
balance sheet
fmva
real estate
Explore Our Certifications
Resources
Popular Courses


Recent Searches