7 Common FP&A Reports Every New Analyst Should Know

FP&A reports drive internal decision-making at every level of a business. For anyone aiming to break into FP&A, these are the reports you’ll encounter in an FP&A role. They help leadership stay on top of performance, manage budgets, and adjust strategies in real time.

This guide breaks down the most common reports in FP&A. You’ll learn what each report includes, who uses it, and how it drives better business decisions. Whether you’re transitioning from another finance role or preparing for FP&A interviews, familiarity with these reports helps you speak confidently about the role and understand what hiring managers expect.

FP&A Reports for New Analysts

Key Highlights

  • Reports are a core responsibility in any FP&A role with a blend of monthly and quarterly reports, weekly flash reports, ad hoc analysis, and more. 
  • Every FP&A report answers different business questions, from tracking immediate performance to guiding long-term strategy.
  • Building FP&A reports requires key skills in accounting and Excel, financial modeling, analysis, and the ability to connect numbers to business decisions.

1. Month-End Report

The month-end report captures business performance at a critical checkpoint. Did the company hit its targets? Where did it fall short? This report answers those questions.

Each month, the accounting team closes the books and prepares the financial statements. Then FP&A analyzes the results to understand what drove that month’s financial performance. The analysis connects financial results to what’s actually happening in the business.

A comprehensive month-end report typically includes:

  • Core financial statements, including the income statement, balance sheet, and cash flow statement, along with reconciliations.
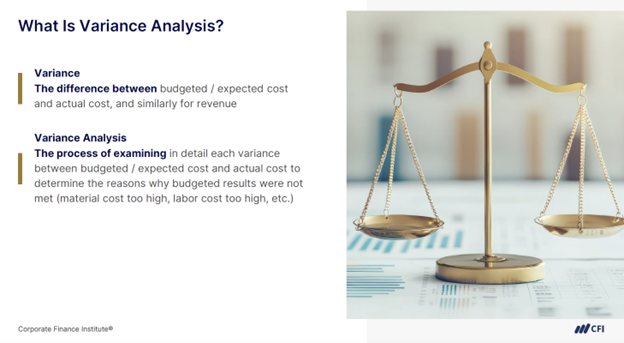
  • Variance analysis, showing actuals versus budget with explanations for major differences.
  • Key financial KPIs, such as gross margin, operating margin, and working capital.
  • Operational metrics, such as churn rate or customer acquisition cost, depending on the business model.
  • Forward-looking insights, including updated forecasts, scenario analysis, and identified risks or opportunities.

Month-end reporting gives leadership the data to make quick adjustments. These insights shape decisions on resource allocation, hiring, and strategic priorities.

FP&A Reports for New Analysts - What is Variance Analysis
Source: CFI’s Budgeting Processes course

2. Quarterly Business Review (QBR)

The quarterly business review (QBR) combines performance tracking with strategic planning. FP&A leads the preparation of this critical report, which helps leadership assess whether the business is on track to meet its longer-term goals.

Unlike month-end reports that focus on immediate results, the QBR takes a broader view. This report is typically shared in a live meeting with the executive team and sometimes the board of directors. The presentation blends financial data with narrative context to show not just what happened, but what it means for the business going forward.

A strong QBR includes:

  • Quarterly financial performance, compared to plan and prior periods.
  • Strategic initiative updates, showing progress on product launches, market expansions, or cost reduction efforts.
  • Cross-functional KPIs, highlighting performance across different teams or business units.
  • Forward-looking guidance, such as updated revenue or margin expectations.
  • Key decisions and recommendations, like reallocating resources, delaying initiatives, or expanding investments.

The QBR gives leaders a comprehensive view of business health and momentum. It connects financial outcomes to strategic priorities and helps leadership decide where to focus next quarter.

3. Latest Estimate / Outlook Report

A latest estimate, also known as an outlook report, is a periodic update where FP&A revises the most current forecast and compares it to the prior forecast. It’s a crucial check-in that helps leadership realign expectations before the formal month-end close or the next QBR.

This report typically comes mid-month or runs on a rolling cadence. The outlook report focuses on the near-term future. It highlights what’s changed, how the business is trending, and what the updated numbers suggest.

What’s included:

  • Revised forecasts of revenue, costs, margins, EBITDA, and cash flow for the upcoming period or fiscal year.
  • Changes in key assumptions, such as price adjustments, volume shifts, operational disruptions, or cost inflation.
  • Comparison to the prior forecast to highlight what’s tracking, improving, or deteriorating.
  • Highlights of what’s changed in the market or internal environment since the last outlook.

The Latest Estimate helps leadership course-correct without waiting for formal reporting cycles. If revenue projections drop mid-quarter, leaders can act immediately rather than discovering problems after the fact.

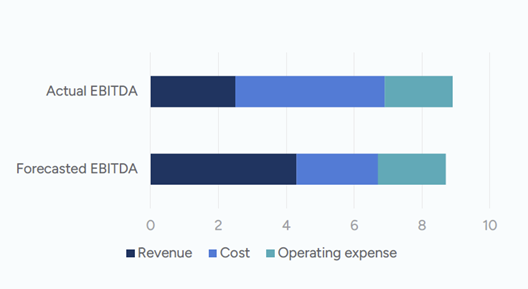
FP&A Reports for New Analysts - Actual EBITDA vs Forecasted EBITDA
Source: CFI’s FP&A for New Analysts course

4. Weekly Flash Report

A flash report is a concise, one-page weekly summary of a company’s key financial and operational performance metrics. FP&A uses flash reports to give executives a snapshot of what’s happening in the business now. Unlike month-end reports and QBRs, flash reports deliver quick insights rather than precise numbers. Most companies accept 80-90% accuracy for flash reports.

Flash reports vary by business, but most focus on three core areas:

  • Liquidity and cash: Cash balance, operating cash flow, and status of accounts receivable aging and accounts payable outstanding.
  • Profitability: Weekly revenue, gross margin, and EBITDA, often shown with variances to budget or forecast.
  • Operations and productivity: Function-specific metrics like inventory turnover, website traffic, labor hours, or support volumes.

Weekly flash reports help executives react quickly to what’s happening now. If cash is tightening or sales are surging, leadership knows within days rather than at the end of the month. This rapid feedback loop keeps leadership ahead of problems rather than chasing them.

5. Headcount Report

The headcount report focuses on one of the biggest cost drivers in any business: labor. It tracks current staffing levels, new hires, turnover, and open roles. While HR owns the underlying data, FP&A takes the lead on reporting and analysis. They reconcile actual headcount with the budget, evaluate changes over time, and forecast future staffing needs.

A well-structured headcount report helps the business:

  • Control labor costs by tracking compensation, benefits, and headcount-related expenses.
  • Understand resourcing trends, like where hiring is accelerating or stalling across the business.
  • Plan more accurately by comparing current headcount to budgeted targets.
  • Identify gaps that may affect the execution of initiatives due to understaffing. 

These insights support decisions about where to ramp up hiring, where to pause, and how shifts in headcount will affect spending. 

FP&A also uses this data to stress test forecasts. When headcount and performance metrics start moving in opposite directions, this report provides the early warning that leadership needs to adjust course.

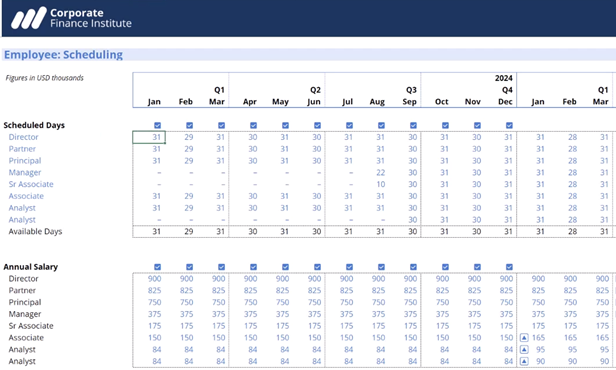
FP&A Reports for New Analysts - Headcount Analysis
Source: CFI’s FP&A Modeling Part 3 – Headcount Analysis course

6. Sales Pipeline Analysis

A sales pipeline analysis reviews all active deals to forecast revenue and guide planning decisions. FP&A uses this forward-looking data to understand what’s coming.

By analyzing the pipeline, FP&A helps the business:

  • Project revenue and adjust resource plans accordingly.
  • Identify risks like declining conversion rates or lengthening sales cycles.
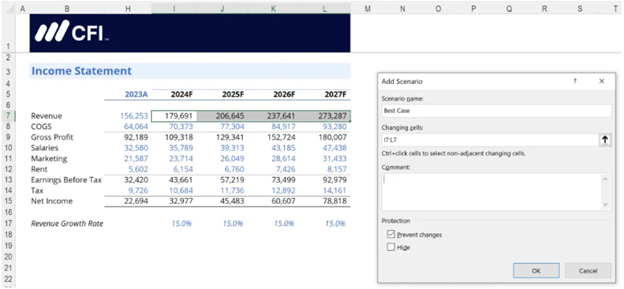
  • Test scenarios with what-if analysis to understand potential impacts on revenue.
  • Time key decisions around hiring, marketing spend, and operations.

Pipeline data improves forecasting accuracy and helps leadership respond quickly when performance shifts. For example, a sharp drop in qualified leads might trigger a hiring pause or prompt a pricing strategy review.

FP&A goes beyond reporting pipeline metrics. It connects sales activity to financial outcomes and recommends specific actions. When pipeline trends change, FP&A models the financial impact and identifies what operational adjustments will keep the business on track.

FP&A Reports for New Analysts - What-If Analysis
Example of What-If Analysis in Excel

7. Ad Hoc Reports

Ad hoc reporting refers to analysis done on demand to answer specific business questions. Unlike scheduled reports, these requests come up unexpectedly when leadership needs quick answers.

For FP&A, ad hoc reporting is a core responsibility. It requires flexibility and the ability to turn messy data into useful insights quickly. These requests often come from senior leadership or cross-functional partners.

Common requests include:

  • Analyzing the impact of a pricing change or promotional offer.
  • Sizing a new market opportunity.
  • Exploring the financial implications of a hiring freeze.
  • Providing quick views of segment performance or customer profitability.

Effective ad hoc reporting helps decision makers act with confidence when time is short. FP&A’s ability to deliver these insights quickly and accurately reinforces their role as a strategic partner, providing clear recommendations that cut through complexity.

FP&A Reports: Prepare Through Skill-Building

FP&A reports follow a relentless rhythm of weekly flashes, monthly closes, and quarterly reviews at a minimum. Each report builds on the previous, creating a continuous cycle of analysis and insight that keeps businesses on track.

Learning to navigate this reporting cycle effectively takes more than reading about reports. You need hands-on practice building forecasts, creating variance analyses, and turning data into insights that drive decisions.

CFI’s FP&A Specialization equips you with the skills and knowledge to excel as an FP&A professional. Emerge from this program prepared to support business leaders with top-tier financial models, budgets, forecasts, analysis, and more. Learn the techniques used by top finance teams at Amazon, JPMorgan, and PwC.

Start Learning Today!

Additional Resources

Comparative Periods in FP&A

The Budgeting Process: Step-by-Step Guide

FP&A Modeling Best Practices

See all FP&A resources

0 search results for ‘