Get Certified for Financial Modeling (FMVA)®
Gain in-demand industry knowledge and hands-on practice that will help you stand out from the competition and become a world-class financial analyst.
A useful tool to quantify an investment's riskiness
From a statistics standpoint, the standard deviation of a dataset is a measure of the magnitude of deviations between the values of the observations contained in the dataset. From a financial standpoint, the standard deviation can help investors quantify how risky an investment is and determine their minimum required return on the investment.

We can find the standard deviation of a set of data by using the following formula:
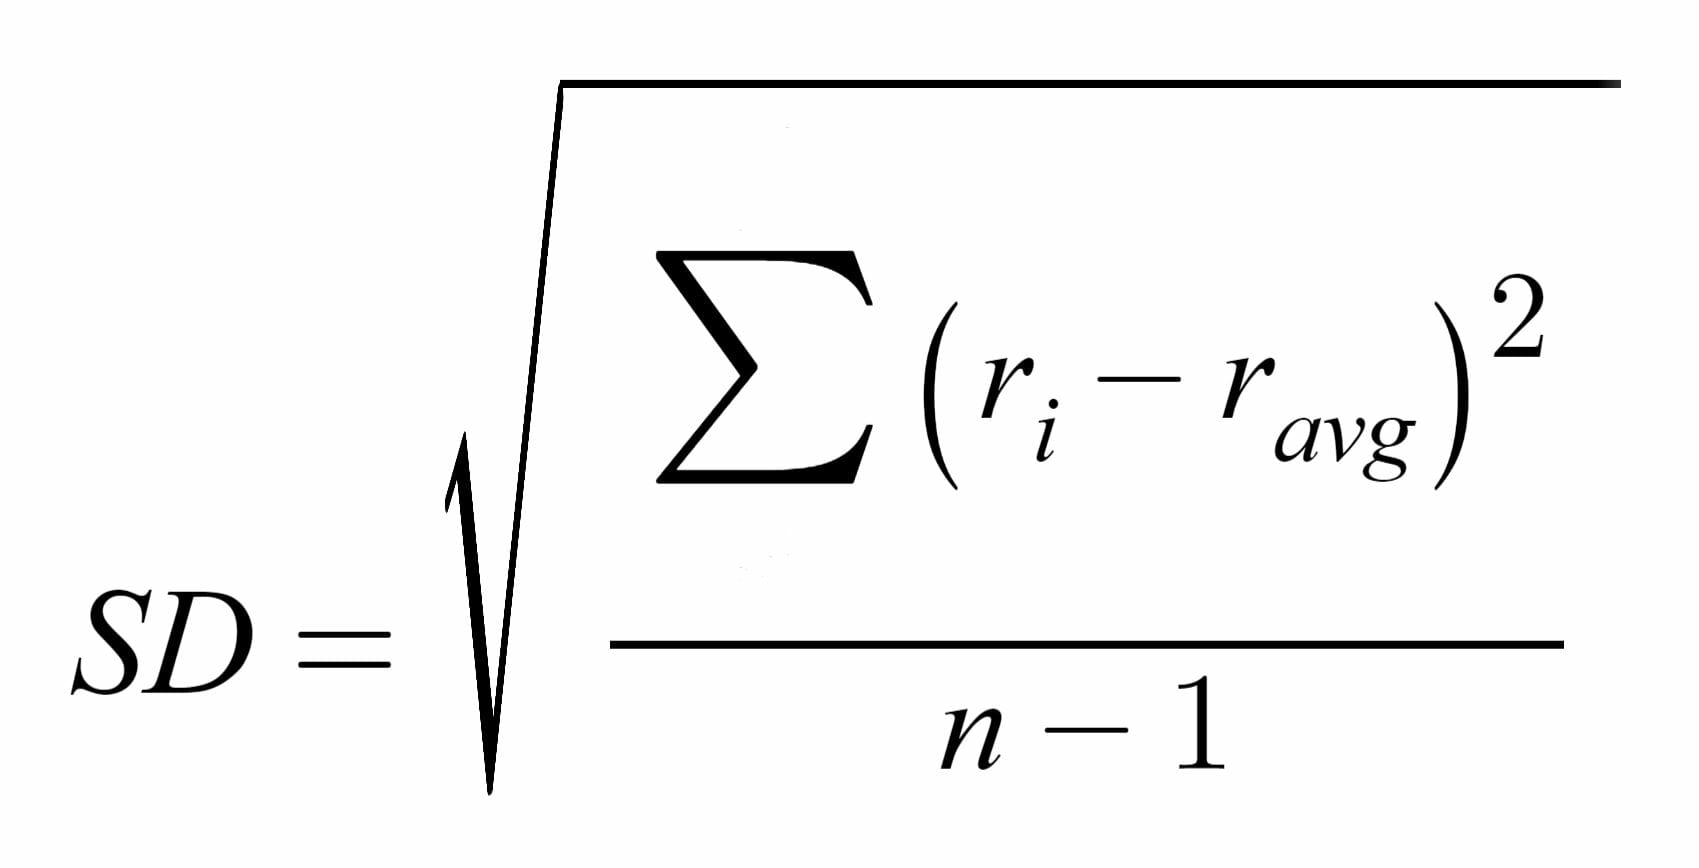
Where:
By using the formula above, we are also calculating Variance, which is the square of the standard deviation. The equation for calculating variance is the same as the one provided above, except that we don’t take the square root.
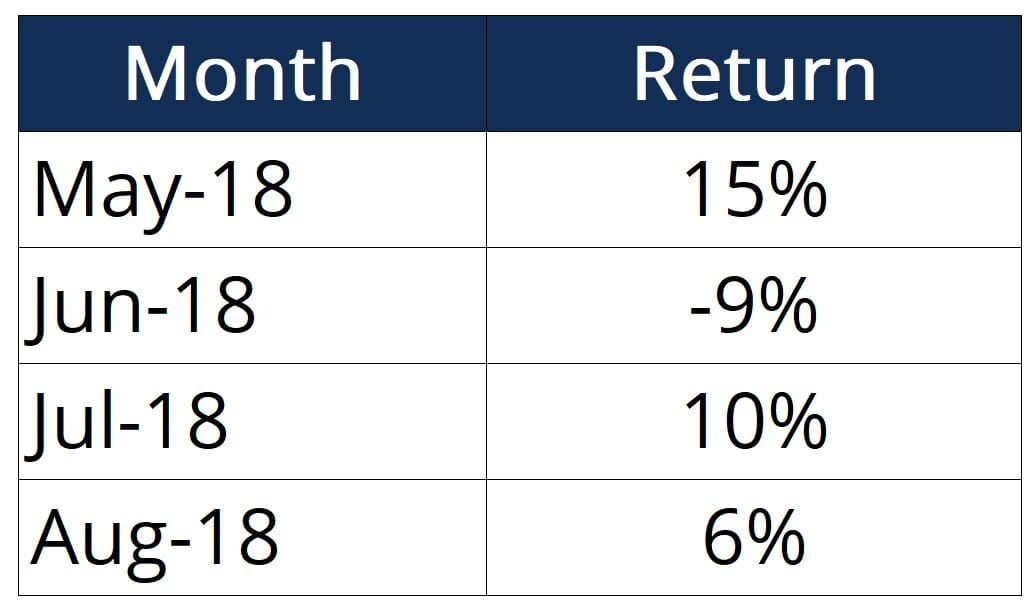
An investor wants to calculate the standard deviation experience by his investment portfolio in the last four months. Below are some historical return figures:
The first step is to calculate Ravg, which is the arithmetic mean:
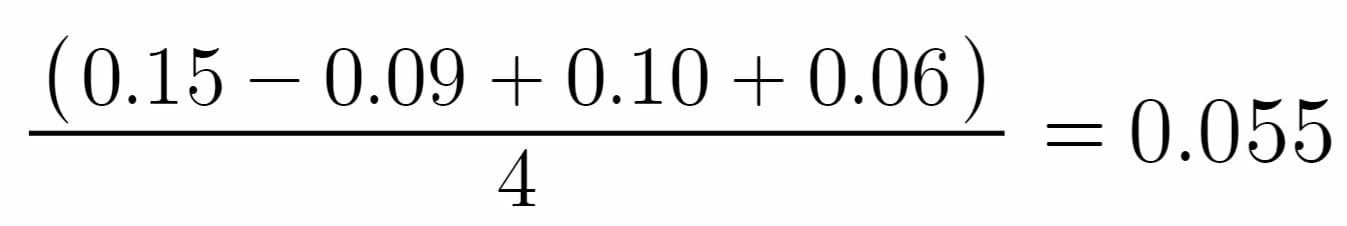
The arithmetic mean of returns is 5.5%.
Next, we can input the numbers into the formula as follows:
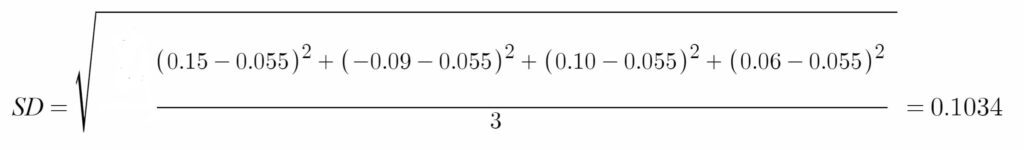
The standard deviation of returns is 10.34%.
Thus, the investor now knows that the returns of his portfolio fluctuate by approximately 10% month-over-month. The information can be used to modify the portfolio to better the investor’s attitude towards risk.
If the investor is risk-loving and is comfortable with investing in higher-risk, higher-return securities and can tolerate a higher standard deviation, he/she may consider adding in some small-cap stocks or high-yield bonds. Conversely, an investor that is more risk-averse may not be comfortable with this standard deviation and would want to add in safer investments such as large-cap stocks or mutual funds.
The normal distribution theory states that in the long run, the returns of an investment will fall somewhere on an inverted bell-shaped curve. Normal distributions also indicate how much of the observed data will fall within a certain range:
The graphic below illustrates this concept:
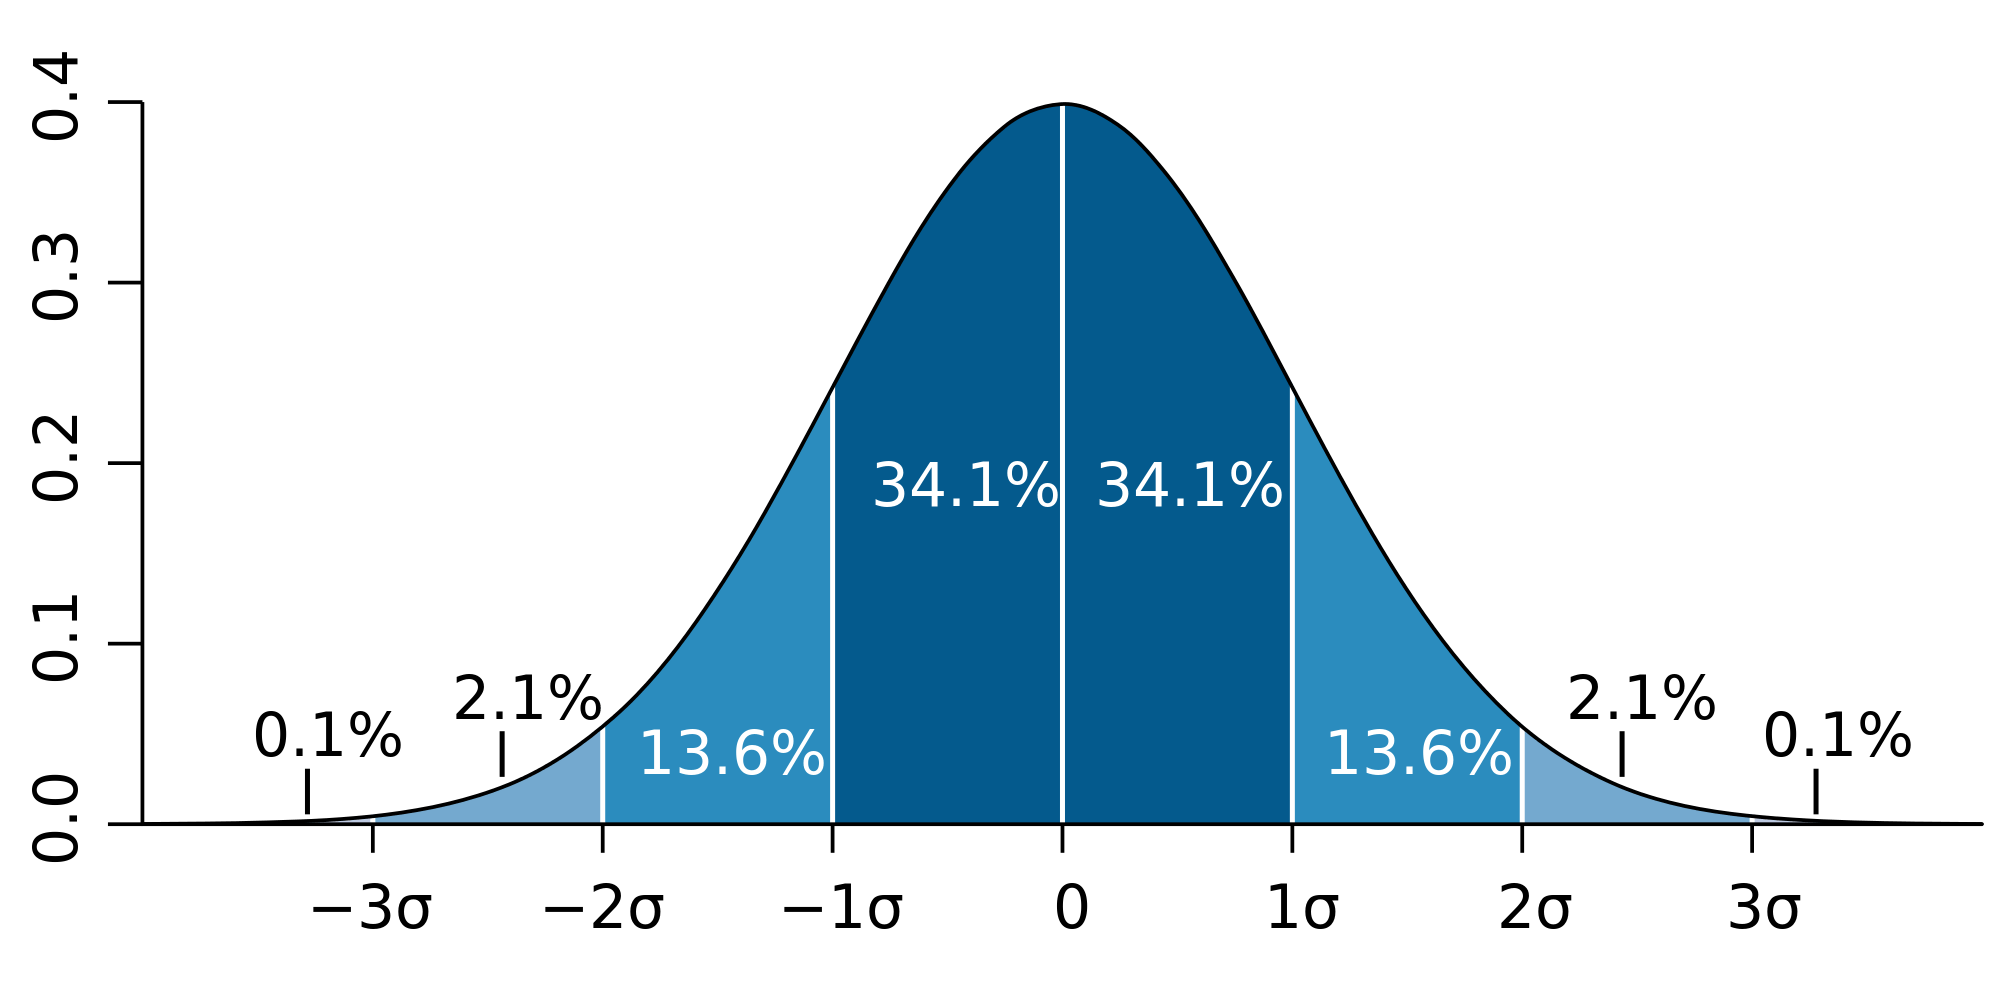
Hence, standard deviations are a very useful tool in quantifying how risky an investment is. Actively monitoring a portfolio’s standard deviations and making adjustments will allow investors to tailor their investments to their personal risk attitude.
Thank you for reading CFI’s guide to Standard Deviation. To learn more about related topics, check out the following resources:


