Get Certified for
Financial Planning & Wealth Management Professional (FPWMP®)
Learn financial analysis & planning, portfolio management, and risk assessment.
A technical indicator used to assess the future movement of prices based on demand and supply
Money flow is a technical indicator used to assess the future movement of prices based on demand and supply. It is used to construct the difference between uptick and downtick dollar trading volume. Money flow, whether flowing in or out, indicates the current excess supply or demand.

Traders determine whether the money flow was positive or negative for the present day by comparing the present value of money flow with previous money flow. Assuming that uptick traders are buyer-motivated and downtick traders are seller-motivated, a positive difference between the uptick dollar volume and the downtick dollar volume is equivalent to excess demand.
When a trade occurs at a higher price than the previous trade, the difference is considered a positive money flow. On the other hand, negative money flow takes place when the next purchases are at a lower price than the former. When the stock is purchased at the same price as the previous stock, the trade does not contribute to money flow.
Money flow can also be determined based on the trade volumes multiplied by transaction price (dollar volume), where money flow is considered positive if the trade occurred on an uptick and negative when the next trade is purchased on a downtick. Positive money flow occurs if investors were willing to pay premiums for the stock, meaning that more shares were purchased on that day on an uptick than a downtick.
A pending price reversal occurs if negative money flow occurs when stock prices are rising. Investors rely on money flow as an indicator of future returns. It is based on the premise that trading volume is habitually considered to lead price; hence, it identifies early trading opportunities.
Money flow is calculated by finding the average of the closing, low, and high prices, and multiplying the result by the daily volume. Consider the example below in which money flow is negative between the first day and the second day.
| Day 1 | Day 2 |
| High: $85 | High: $87 |
| Low: $80 | Low: $77 |
| Closing: $84 | Closing: $86 |
| Daily Volume: 400,000 shares | Daily Closing: 200,000 shares |
| Money Flow = 400,000 × 83 = $33,200,000 | Money Flow = 200,000 × 83 = $16,600,000 |
The above example shows a negative money flow between Day 1 and Day 2.
The Chaikin money flow oscillator is commonly used by traders to make sharper entry and exit point decisions. The indicator was developed by Marc Chaikin and used both volume and closing price to give a clear picture of the price movements.
As with other money flow indicators, the Chaikin money flow oscillator produces values for purchasing and selling pressure. However, what makes the indicator stand out is that it also determines momentum by using two exponential moving averages. The concept is similar to the Moving Average Convergence (MACD) used by other indicators to assess momentum.
The Money Flow Index (MFI) is another commonly used indicator by traders to analyze transaction price and trade volume to determine overbought and oversold levels (excess purchases and sales). A value of 80 or more generally indicates overbought prices. An oversold condition is indicated by a value of 20 or less.
Money flow indicators are used in conjunction with other technical indicators to minimize false trading signals.
The global money flow is used to understand the risks and rewards of global equity investing. It is because risks and rewards are elements of supply and demand. The European stock market was not exciting during the mid-1980s. Instead, they were significantly going up because pension funds from the U.S. and the U.K. were pouring money into them.
At such a time, pension funds diversified their portfolio by going into overseas markets. Traders can, therefore, trade money and other assets among markets across the globe relative to risk. The risk here means the likelihood of not realizing the valuation price of an investment in the future. The idea is not to purchase a security at a low price but also to have its price appreciate.
Understanding the risks and returns of global investments requires knowledge of cash flows, a measure of market attractiveness, and liquidity.
Several factors can explain why money flows the way it does. The factors are as follows:
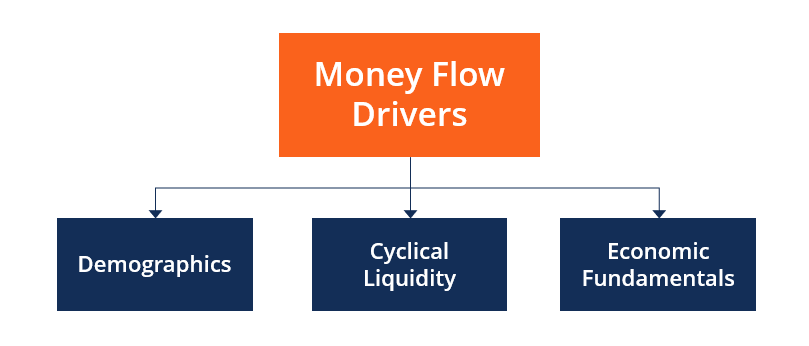
The age distribution of a country’s population influences the amount and pattern of investment in a country. Aging individuals tend to invest in building up pensions, unlike youngsters who are spenders. If the aging population invests in equity-type schemes in a faster-growing economy, pensions will grow more quickly.
In the U.S. today, population aging affects money flows. More people are becoming savers due to significant population aging. The baby boomers no longer spend; rather, they strive to save more.
Cyclical liquidity is the key to understanding the activities of central banks. Liquidity measures the operations of central banks and can be measured at a national or international level. Investors analyze the central banks’ behavior to determine the performance of various asset classes at different stages of the liquidity cycle.
Under economic fundamentals, the fundamental balance is used to monitor when an economy is heading in the wrong direction. A fundamental balance provides a clear picture of a competitive environment that can be compared with others to determine the competitiveness of an economy. Investors will look at what is happening in an economy, particularly the flow of foreign direct investment.
To keep learning and developing your knowledge of financial analysis, we highly recommend the additional resources below:


