Get Certified for Financial Modeling (FMVA)®
Gain in-demand industry knowledge and hands-on practice that will help you stand out from the competition and become a world-class financial analyst.
Understand the meaning of Microsoft Excel, its core functions, and how it’s used to organize data, perform analysis, and automate financial tasks.
Excel is a powerful spreadsheet program developed by Microsoft that enables users to organize, analyze, and visualize data. Used across industries, Microsoft Excel is part of the Microsoft Office suite and supports a wide range of functions, including calculations, automation, and financial analysis.
At its core, Excel is defined as a tool that structures data into rows and columns, allowing users to perform mathematical operations, create charts, and build financial models. Excel is available on Microsoft Windows and macOS, and it is widely used for both personal and professional tasks.
Excel is typically used to organize data and perform financial analysis. It is used across all business functions and at companies from small to large.
Microsoft Excel is a spreadsheet program used to calculate data, organize information, and perform detailed analysis across both personal and professional settings. This incredibly powerful tool supports a wide range of tasks, including:
Excel’s robust feature set includes tools for:
To input formulas in Excel, start with an equal sign (=). Excel also supports operators like the plus sign (+), minus sign (-), and forward slash (/) to perform calculations.
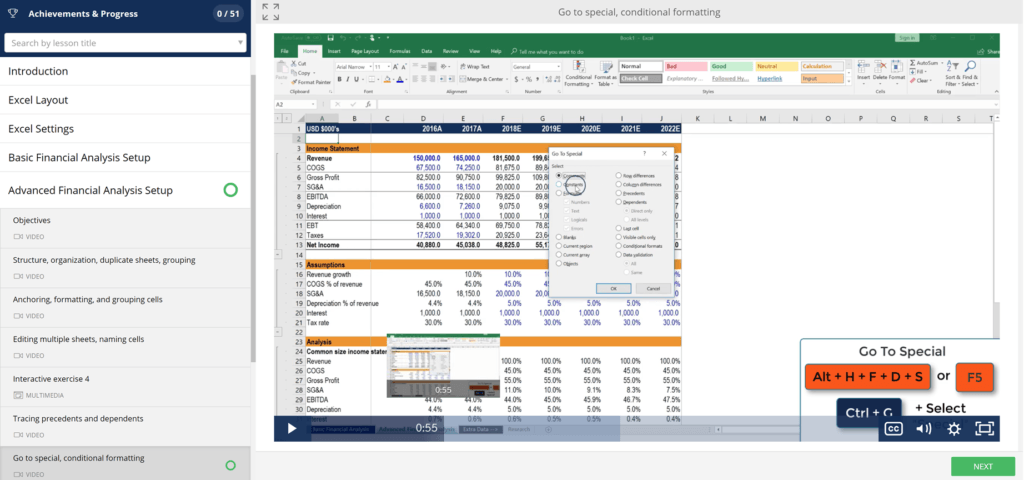
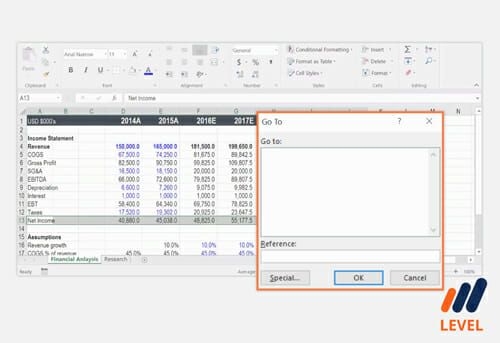
The Excel software program includes many functions, formulas, and shortcuts that can be used to enhance its functionality.
We have defined the key functions and formulas below in our Excel guide:
In the world of finance and accounting, Microsoft Excel is the backbone of everyday operations. Professionals rely on Excel not just for basic number-crunching, but for robust, high-stakes data analysis and financial reporting.
Here’s how Excel is used across financial roles:
Excel’s flexibility, scalability, and ability to handle large datasets make it the default software for accounting teams and financial analysts. With its wide array of formulas, pivot tables, and automation tools, it remains one of the most powerful tools for financial modeling available today.
While Excel is defined as a “data” management tool, the data that is most commonly managed is financial. At CFI, we would define Excel as the ultimate financial software. While there are other financial software tools tailored to specific tasks, the strongest point about Excel is its robustness and openness. Excel models are as powerful as the analyst makes them.
Accountants, investment bankers, analysts, and individuals in various financial career paths rely on Excel to perform their daily job functions.
Connect what you just learned to a clear career path with CFI’s role‑based courses and certification programs.
Thank you for reading CFI’s guide to Microsoft Excel. To keep learning and developing your career, these additional CFI resources will be helpful:
Gain in-demand industry knowledge and hands-on practice that will help you stand out from the competition and become a world-class financial analyst.
Microsoft Excel is a spreadsheet program designed to organize, calculate, and analyze data. It uses a grid of rows and columns to help users work with numbers, formulas, and text efficiently.
Excel is primarily used for tasks like budgeting, data entry, financial modeling, data visualization, and reporting. Businesses use it to manage and make sense of large amounts of data, while individuals use it for personal finances and planning.
Yes. Excel is one of the core programs included in Microsoft Office, alongside Word, PowerPoint, and Outlook. It is also available through Microsoft 365 and accessible via desktop and cloud-based applications.
Macros in Excel are used to automate repetitive tasks. With a few lines of code or by recording your actions, you can reduce manual work and improve workflow accuracy — especially useful for advanced users working with recurring reports or data formatting.
Excel’s power lies in its flexibility and depth. It supports hundreds of built-in functions, allows for the creation of custom formulas, handles large datasets, and integrates with other tools. Whether you’re creating a basic budget or a complex financial model, Excel adapts to the task — making it indispensable for data professionals and business users alike.


