Get Certified for Financial Modeling (FMVA)®
Gain in-demand industry knowledge and hands-on practice that will help you stand out from the competition and become a world-class financial analyst.
Imagine performing financial analysis on a national grocery chain. You notice low account receivables and fast-moving inventory, but accounts payable are stretched to 60 days. When you calculate working capital, the result is negative — a red flag? Not necessarily.
Encountering negative working capital might initially raise concerns. While financially healthy companies typically maintain positive working capital to cover short-term obligations, certain business models, like retail grocery stores, operate efficiently with negative working capital.
Distinguishing between healthy and troubling negative working capital strengthens your financial analysis. This knowledge allows you to accurately interpret this metric across different business contexts, adding depth to your analyses.
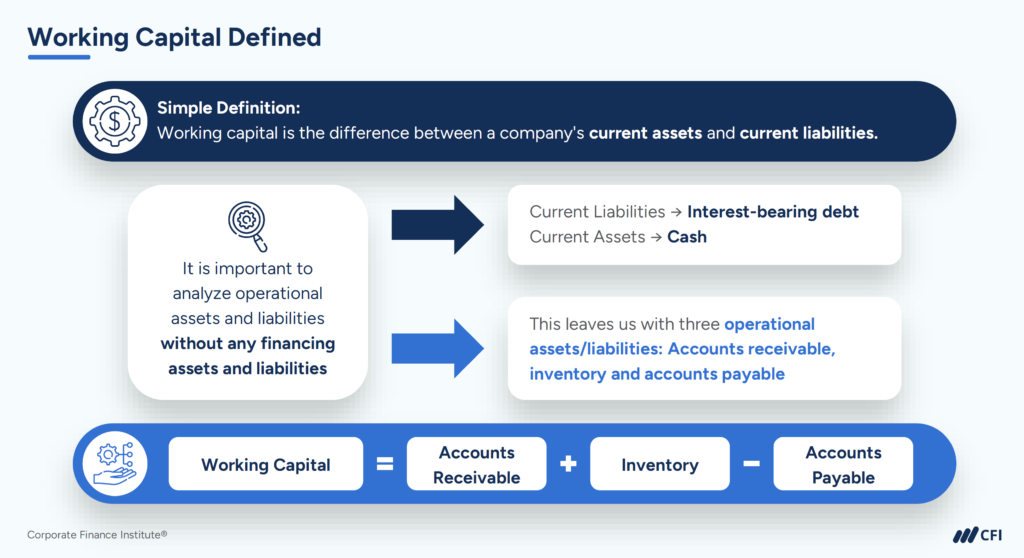
Negative working capital occurs when a company’s current liabilities exceed its current assets. Suppose you calculate net working capital for a company using the basic working capital formula: Accounts Receivable + Inventory – Accounts Payable. Your calculation produces a negative result — you’re looking at negative working capital.
Negative working capital appears most commonly in certain retail operations, particularly those selling fast-moving consumer goods like Amazon, and subscription-based business models like Netflix. As you develop your analytical skills, recognizing the patterns associated with intentional versus problematic negative working capital will enhance your ability to deliver accurate financial assessments.
When you encounter negative working capital, first determine whether it represents operational strength or financial distress. This assessment requires examining the Cash Conversion Cycle (CCC), which reveals how efficiently a company manages its inventory, collections, and payments.
Where:
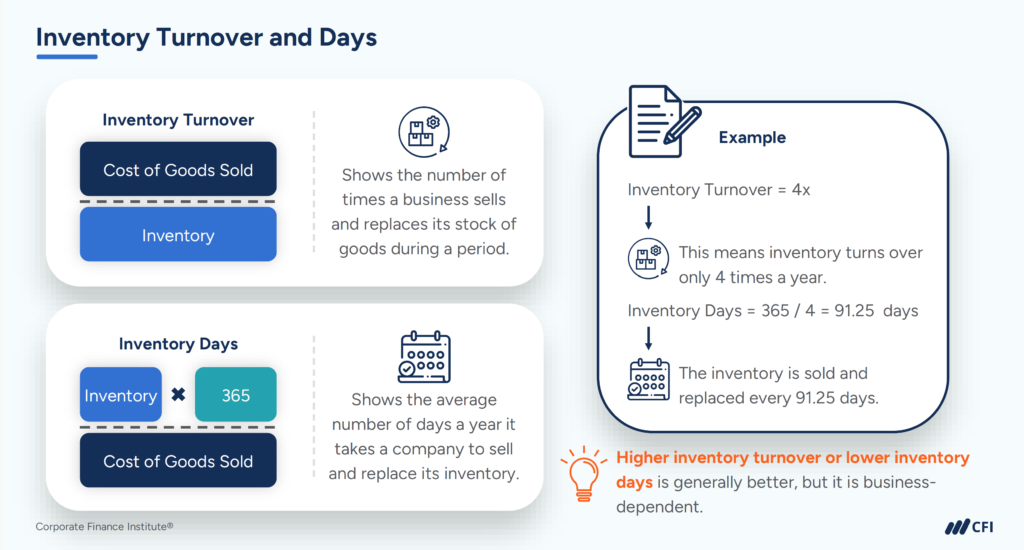
Example Calculation for a Retail Business
Perform the Cash Conversion Cycle calculation (CCC = 30 + 5 – 60 = -25 days) for a result of negative 25 days.
A negative 25-day cycle means the retailer receives cash from customers long before it needs to pay suppliers. In this case, negative working capital is a sign of operational efficiency, not financial weakness.
In retail companies, particularly those selling groceries and household goods, negative working capital often indicates a strong operational model. Well-managed retailers strategically leverage this model to free up cash that would otherwise be tied up in operations, creating a competitive advantage.
This intentional approach to working capital management differs significantly from companies experiencing negative working capital due to financial distress.
When evaluating working capital trends, be alert to sudden changes in negative working capital that don’t align with business model expectations. For instance, if AP days suddenly extend far beyond industry norms, this may indicate the company is stretching payments to suppliers due to cash flow problems.
| Accounts Payable Days (AP Days) | Consistent with industry norms and aligned with supplier terms | Rapidly increasing beyond industry norms (may signal cash flow stress) |
| Inventory Turnover | Steady or improving; inventory levels appropriate for the business model | Slowing turnover or rising inventory levels (tying up cash) |
| Accounts Receivable Days (AR Days) | Stable or declining; customers are paying promptly | Increasing AR days; delayed collections can tighten cash flow |
| Revenue Trends | Stable or growing alongside negative working capital | Declining revenue while working capital position worsens |
| Gross Margins | Stable or improving margins support operational health | Deteriorating margins with no offsetting working capital improvements |
| Pattern Over Time | Consistent across multiple years; reflects structural efficiency in business model | Sudden changes or inconsistent patterns in working capital components |
A consistent pattern of relatively stable negative working capital in retail is generally positive, while erratic patterns or extremes warrant deeper investigation in your analysis.
So far, this analysis has treated accounts payable as a straightforward reflection of how a company manages its suppliers. In practice, a growing share of payables on modern balance sheets is not simple trade credit at all — they are supply chain finance (SCF) arrangements, also called reverse factoring, trade payables finance, or structured payables programs.
Recognizing these arrangements is essential because they can make negative working capital appear to be an operating improvement when it is really a financing decision in disguise.
In a typical SCF arrangement, a bank or specialty finance provider pays the company’s suppliers early (often at a discount), and the company repays the finance provider later — usually on materially longer terms than it ever negotiated directly with the supplier. From the supplier’s perspective, this looks like factoring.
From the buyer’s point of view, the obligation is generally still presented as a trade payable, and for many programs, that reflects the substance, since the payment terms have not changed. The presentation becomes questionable when the program extends terms well beyond what the company negotiated directly, at which point the obligation is more closely akin to a borrowing.
This matters directly for the Cash Conversion Cycle framework used earlier in this article. A company can stretch DPO by renegotiating better terms with suppliers (an operational improvement) or by routing payables through an SCF program, where a finance provider pays the supplier early while the company pays on extended terms (a financing effect).
Both produce the same improved DPO and the same negative working capital position, though they have different economic sources. The DuPont comparison used earlier (RetailCo’s 20% ROE driven by negative working capital) will read differently depending on how much of that working capital position comes from supplier financing rather than from payment terms negotiated directly with suppliers.
Historically, SCF programs were under-disclosed. The UK construction and outsourcing company Carillion collapsed in 2018 partly because analysts could not see how much of its payables balance was structured trade finance rather than ordinary credit — the company’s reported working capital position understated its real leverage. Regulators and standard setters responded:
Neither standard changed how these obligations are measured or classified, only what must be disclosed about them. That is precisely why a working capital analyst needs to know where to look.
When a company’s DPO or negative working capital position looks stronger than peers, or has moved sharply without a clear operational explanation, check:
Add a modifier to the Red Flags checklist introduced earlier in this article:
| AP Days vs. Industry Norms | Consistent with peers | Extending faster than peers, unexplained by renegotiated terms |
| Supplier Finance Disclosure | No program, or a disclosed program with a modest and stable balance | Large or fast-growing confirmed balance under an SCF program |
| Payment Terms | Aligned with disclosed standard supplier terms | Materially longer than standard terms, enabled by a finance provider |
| Cash Flow Classification | Classification consistent with the program terms as disclosed | Terms indicate a borrowing, but flows run through operating activities |
The core lesson for learners: negative working capital arising from stable, directly negotiated trade credit terms is an efficiency signal. Negative working capital arising from a large or rapidly growing supplier finance program is a financing position recorded on a working capital line and carries the risk profile of short-term bank funding rather than trade credit. If the finance provider withdraws the facility, the payment terms it enabled disappear.
Supplier finance is a legitimate tool, and many programs do exactly what they are designed to do, which is to lower financing costs for suppliers. The analyst’s job is not to treat every program as a warning sign but to read the disclosures and price the difference. Those disclosures are now required under both IFRS and US GAAP, which means the ratio should not be trusted until they have been read.
To properly assess working capital efficiency, incorporate these analytical approaches:
Let’s compare a retailer with negative working capital (RetailCo) to a manufacturer with positive working capital (BuildCo). Both earn the same net income, but their balance sheet structures are very different.
| Net Income | ||
| Revenue | ||
| Total Assets | ||
| Shareholders’ Equity | ||
| Asset Turnover | ||
| Equity Multiplier | ||
| Net Profit Margin | ||
| ROE (DuPont) |
This table illustrates how negative working capital, when managed well, can boost efficiency and returns.
When analyzing financial statements, negative working capital demands contextual interpretation. In retail and subscription models, it typically signals operational efficiency and strategic advantage. However, in capital-intensive businesses, it often indicates stretched payables rather than efficiency.
Developing strong financial analysis skills gives you a professional edge. Accurately interpreting key metrics elevates your work from surface-level reviews to strategic insights. This analytical depth becomes particularly valuable in financial modeling and valuation, where understanding business dynamics delivers the actionable intelligence decision-makers need.
Ready to advance your financial analysis skills? Earning CFI’s industry-recognized Financial Modeling & Valuation Analyst (FMVA®) Certification equips you with practical skills to stand out in today’s competitive market. Through structured courses, hands-on case studies, and guided practice, you learn to build sophisticated financial models that drive business decisions.