Get Certified for
Business Intelligence (BIDA®)
Develop analytical superpowers by learning how to use programming and data analytics tools such as VBA, Python, Tableau, Power BI, Power Query, and more.
Python is one of the most popular languages for data analysis, thanks in large part to the powerful third-party libraries built for it. Among thousands of options, four Python libraries for data analysis stand out for their versatility and ease of use: NumPy, Pandas, Matplotlib, and Seaborn. These four libraries are the best to learn first because of their widespread use in finance and robust functionality for data analysis.

In Python, a library is a collection of pre-written code that you can use to perform specific tasks without having to program everything from scratch. Think of it as a shortcut: you can use functions from a library instead of coding everything yourself. Both programmers and finance professionals use Python libraries extensively across data analysis, financial modeling, algorithmic trading, risk management, and quantitative finance.
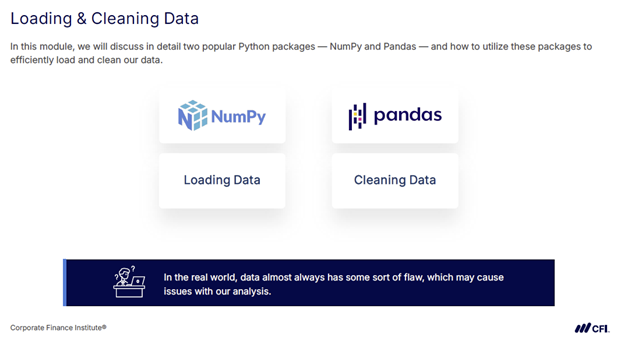
Data analysts often work with messy spreadsheets, large datasets, and complex financial models. Python libraries like NumPy, Pandas, Matplotlib, and Seaborn give you simple commands to handle those tasks quickly and accurately. Instead of spending hours writing low-level code, you can focus on interpreting the data and making decisions. That’s why these libraries are essential Python data analysis tools.
Python supports a large ecosystem of third‑party libraries, making the options for data analysis seem endless.
Start with these four core Python libraries:
Together, these libraries cover numerical computation, loading and cleaning data, analyzing data, and visualizing results. Once you’re comfortable with these, explore more specialized packages as your needs grow.
NumPy is the logical first step, providing the foundation for efficient numerical computation in Python.
NumPy, short for Numerical Python, features the NumPy array, which is similar to a Python list but designed specifically for data analysis. These arrays look like rows or tables in a spreadsheet, but they’re built for efficiency. Compared to regular lists, NumPy arrays take up less memory, run faster, and include helpful methods for quickly calculating things like sums, averages, and more.
NumPy arrays come with several powerful built-in features that make them ideal for working with structured data:
NumPy is especially useful when you’re working with large amounts of numerical data and need structured, memory-efficient storage with fast calculations. It often serves as the starting point for more advanced analysis, and many other libraries are built on top of it.
NumPy provides the performance and simplicity that make it a go-to tool for working with structured numerical data.
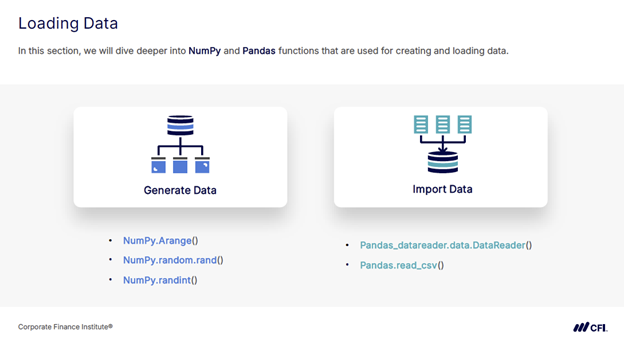
Pandas is one of the most widely used Python data analysis tools. It builds on NumPy and introduces two key data structures:
Series and DataFrame let you work with labeled, tabular data, similar to a spreadsheet, but with far greater flexibility and analytical power. Pandas makes it easy to organize and prepare data for analysis, all while keeping labels intact for clarity and reference.
Pandas includes a wide range of built-in tools for managing and analyzing data efficiently:
Pandas is ideal for scenarios like analyzing sales transactions, cleaning customer lists, preparing datasets for visualization, or aggregating financial performance by category. It combines the performance benefits of NumPy with user-friendly features for handling labeled, tabular data. This functionality makes it one of the most versatile tools in a data analyst’s workflow.
With cleaned and organized data in place, Matplotlib and Seaborn can help you turn numbers into clear and customizable visuals.
Matplotlib is a powerful library for data visualization in Python. It’s widely used for creating foundational chart types like line graphs, bar charts, and scatter plots. The pyplot module within Matplotlib allows you to build and customize visuals step by step. Pyplot lets you adjust everything from colors and line styles to axis labels, text, and figure size.
Matplotlib offers precise control over every element of a chart, including:
Matplotlib offers flexibility for designing charts exactly the way you want them, making it a cornerstone library for professional-quality data visualization. For example, Matplotlib helps you match visuals to corporate branding, adjust fine details for publication, or create highly customized data presentations.
For polished statistical visuals with minimal setup, Seaborn builds on Matplotlib and makes the process even faster.
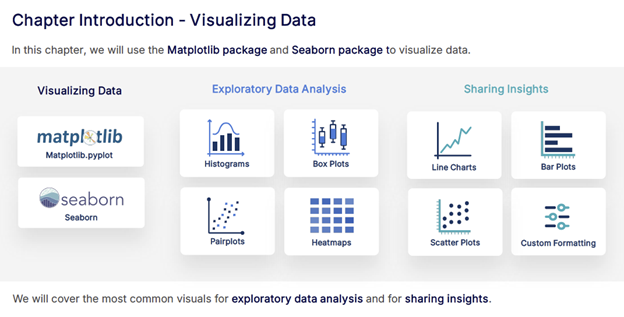
Seaborn is built on top of Matplotlib and is designed to make complex data visualizations simple and attractive. Seaborn also works directly with Pandas DataFrames, making it easy to create polished visuals from your existing datasets.
Seaborn simplifies statistical data visualization with features like:
Seaborn is ideal for quickly exploring data patterns and relationships, especially when you want clear, attractive visuals with minimal effort. It’s often used to spot trends, compare categories, or highlight correlations in your data.
Seaborn combines powerful statistical visualization tools with elegant default styles, making it the fastest way to create insightful, presentation-ready charts.
Learn more about the data visualization applications of Matplotlib and Seaborn in CFI’s Data Analysis with Python course.
NumPy, Pandas, Matplotlib, and Seaborn are four of the most widely used Python data analysis tools. Whether you’re performing numerical calculations, cleaning and organizing tabular datasets, or creating clear and informative visualizations, these libraries give you the capabilities to work efficiently with data.
Mastering Python opens the door to larger datasets, advanced analyses, and projects like predictive modeling, automated workflows, and interactive dashboards.
Ready to take your Python skills further?
CFI’s flexible, on-demand courses take you from beginner to advanced, building expertise through interactive exercises and hands-on labs. You’ll practice applying your skills with real datasets and case studies, and gain the confidence to program for finance and business applications. Explore CFI’s catalog of Python courses to start learning today!


