Get Certified for Financial Modeling (FMVA)®
Gain in-demand industry knowledge and hands-on practice that will help you stand out from the competition and become a world-class financial analyst.
The speed at which a business sells its inventory
Inventory turnover, or the inventory turnover ratio, is the number of times a business sells and replaces its stock of goods during a given period. It considers the cost of goods sold, relative to its average inventory for a year or for any set period of time.
A high inventory turnover generally means that goods are sold faster, and a low turnover rate indicates weak sales and excess inventories, which may be challenging for a business.
Inventory turnover can be compared to historical turnover ratios, planned ratios, and industry averages to assess competitiveness and intra-industry performance. Inventory turns can vary significantly by industry.
The inventory turnover ratio formula is given as follows:
Cost of goods sold is an expense incurred from directly creating a product, including the raw materials and labor costs applied to it. However, in a merchandising business, the cost incurred is usually the actual amount of the finished product (plus shipping cost if any is applicable) paid for by a merchandiser from a manufacturer or supplier.
In both types of businesses, the cost of goods sold is properly determined by using an inventory account or a list of raw materials or goods purchased that is maintained by the owner of the company.
Average inventory is the average cost of a set of goods during two or more specified time periods. It takes into account the beginning inventory balance at the start of the fiscal year plus the ending inventory balance of the same year.
These two account balances are then divided in half to obtain the average cost of goods resulting in sales.
Average inventory does not need to be computed on a yearly basis; it may be calculated on a monthly or quarterly basis, depending on the specific analysis required to assess the inventory account.
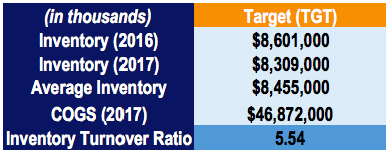
For example, Walmart Inc. (WMT) and Target Corporation reported the following figures in their financial statements:

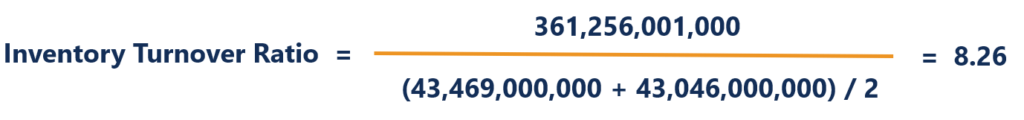
The ratio for Walmart is calculated as follows:
Likewise, the ratio for Target is calculated as follows:
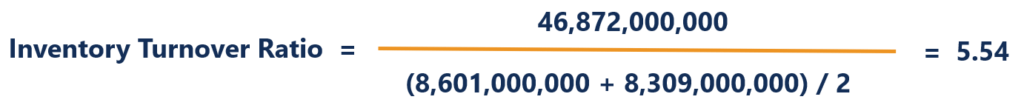
By comparing the inventory turnover ratios of Walmart and Target, two companies that operate mainly in the retail industry, we can see that Walmart sells its inventory 8.26x over a period of one year compared to Target’s 5.54x.
It implies that Walmart can more efficiently sell the inventory it buys. In addition, it may show that Walmart is not overspending on inventory purchases and is not incurring high storage and holding costs compared to Target.
Inventory turnover ratio is an efficiency metric that measures how effectively a company manages its inventory.
A high inventory turnover ratio is desirable, as it helps (1) reduce storage costs, and (2) minimize other holding expenses
Industry comparison is essential because ratios should only be compared between companies within the same industry. Remember that benchmark ratios vary significantly across different industries.
A low inventory turnover ratio may indicate poor sales performance, excess inventory, or ineffective inventory management.
Risks of unsold inventory include exposure to market price fluctuations and risk of becoming obsolete
Inventory’s role in liquidity varies by industry. For example, in retail, inventory is one of the largest reported assets. A low turnover in retail may suggest obsolete stock, lost sales opportunities, or higher holding costs.
Enter your name and email in the form below and download our free Inventory Turnover Calculator Template now!
Below is an example of calculating the inventory turnover days in a financial model. As you can see in the screenshot, the 2015 inventory turnover days is 73 days, which is equal to inventory divided by cost of goods sold, times 365. You can calculate the inventory turnover ratio by dividing the inventory days ratio by 365 and flipping the ratio.
In this example, the inventory turnover ratio = 1 / (73/365) = 5. It means the company can sell and replace its stock of goods five times a year.
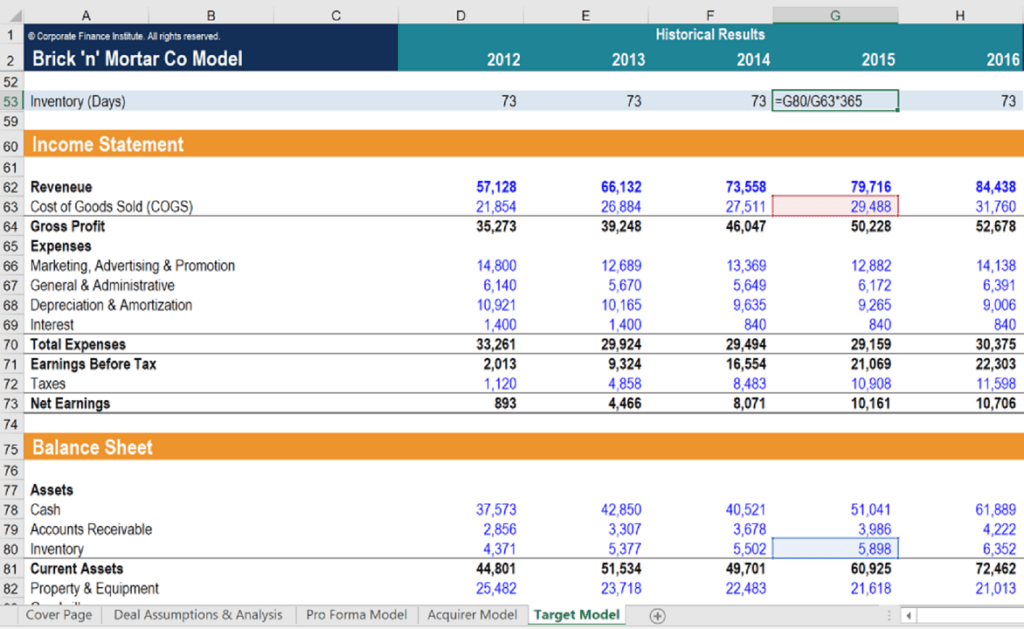
Source: CFI Financial Modeling Courses
One way to assess business performance is to know how fast inventory sells, how effectively it meets the market demand, and how its sales stack up to other products in its class category. Businesses rely on inventory turnover to evaluate product effectiveness, as this is the business’s primary source of revenue.
Higher stock turns are favorable because they imply product marketability and reduced holding costs, such as rent, utilities, insurance, theft, and other costs of maintaining goods in inventory.
Another purpose of examining inventory turnover is to compare a business with other businesses in the same industry. Companies gauge their operational efficiency based on whether their inventory turnover is at par with or surpasses the average benchmark set per industry standards.
The inventory turnover ratio is an efficiency ratio that measures how efficiently inventory is managed. The ratio should only be compared for companies operating in the same industry, as the ratio varies greatly depending on the industry.
A high ratio is always favorable, as it indicates reduced storage and other holding costs. A low ratio implies poor sales, excess inventory, or inefficient inventory management.
Depending on the industry, the ratio can be used to determine a company’s liquidity.
Connect what you just learned to a clear career path with CFI’s role‑based courses and certification programs.
Thank you for reading this guide to better evaluate how inventory turns at a company. To keep learning and advancing your career as a financial analyst, these additional CFI resources will help you:


