Inventory Turnover Calculator
Download our inventory turnover calculator
Inventory Turnover Calculator
This inventory turnover calculator will help you calculate the number of times a business sells and replaces its stock of products within a set period.
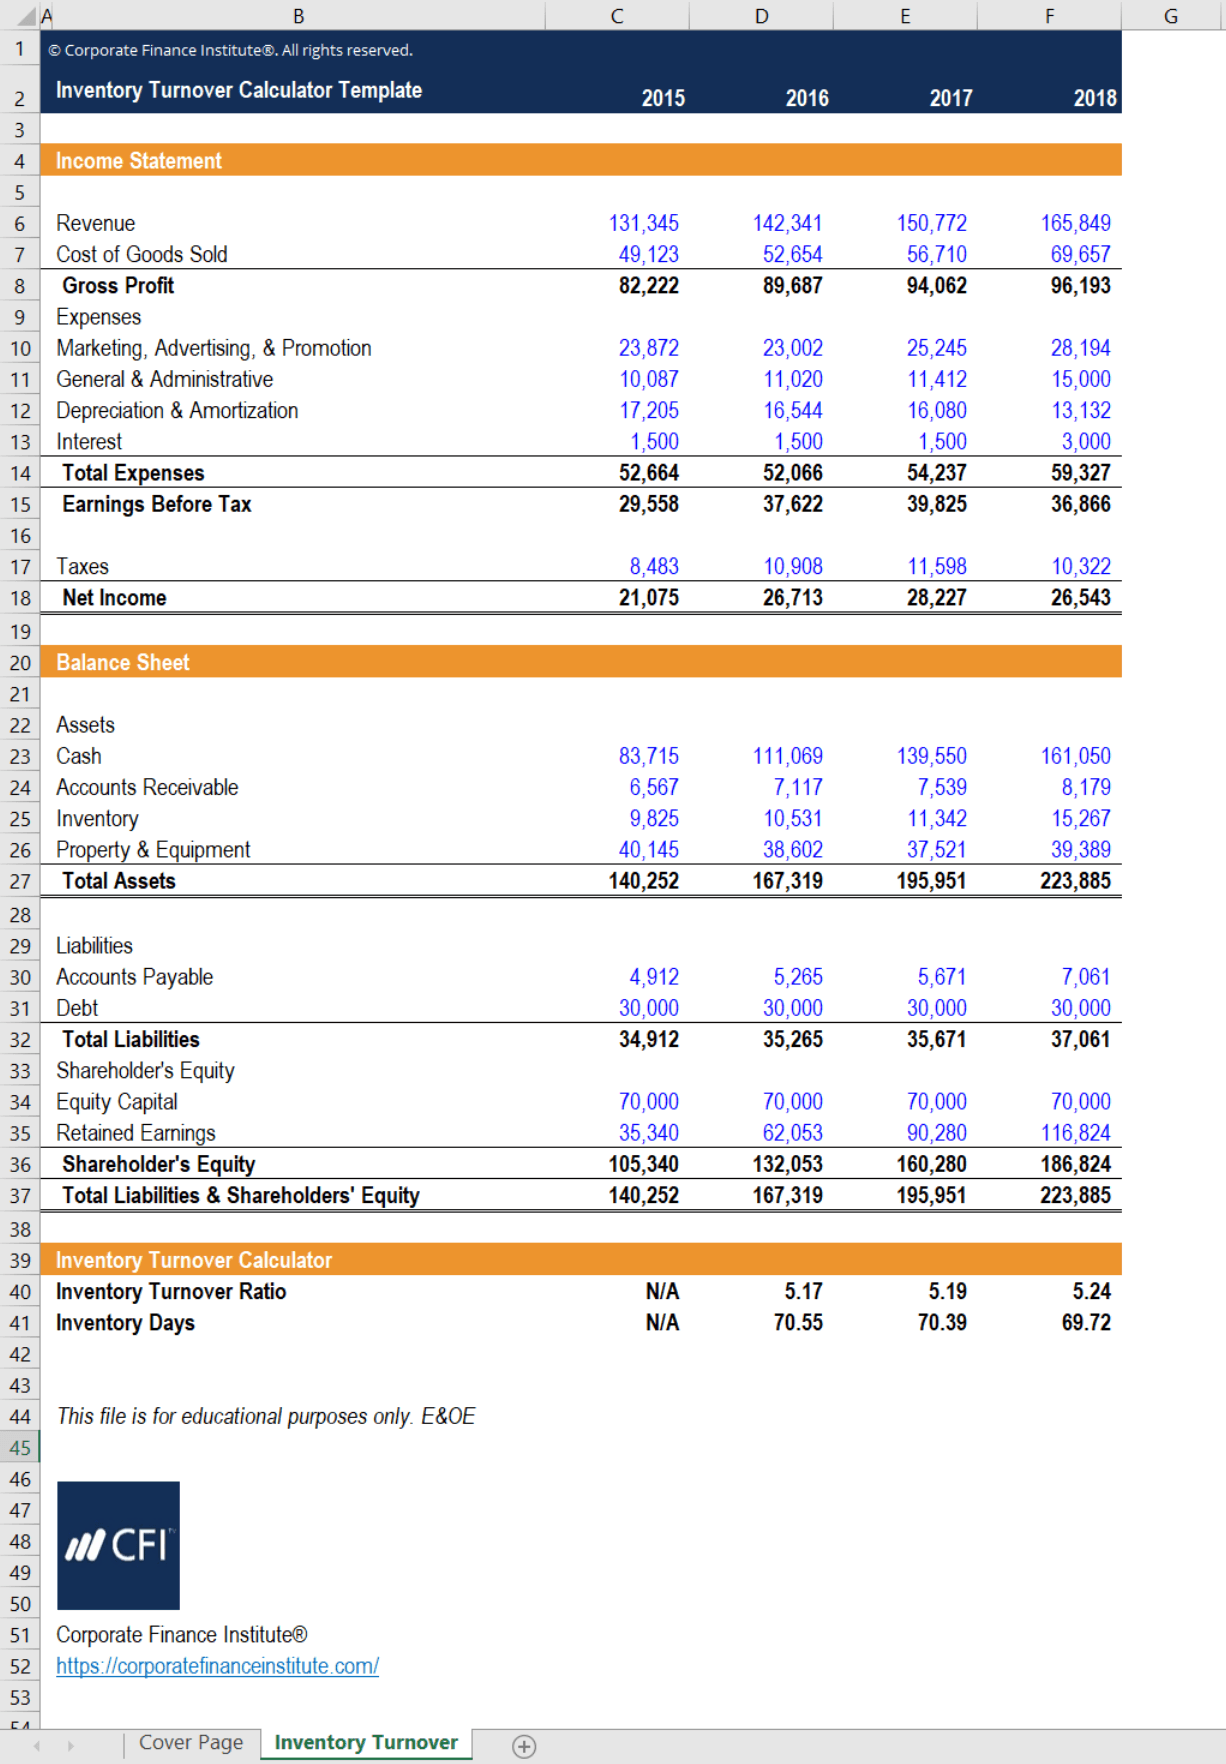
Below is a preview of CFI’s inventory turnover calculator:
Download the Free Template
Calculating and Using Inventory Turnover
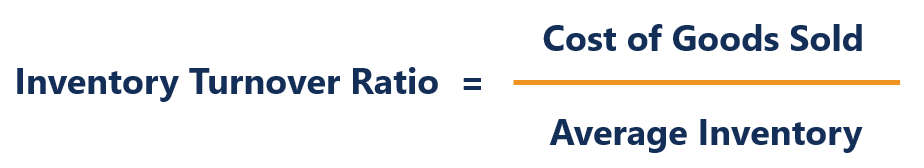
The inventory turnover ratio is calculated using the formula below. CFI’s inventory turnover calculator pulls data from a sample financial statement and uses this formula to calculate the ratio.
The inventory turnover ratio is an important measure in financial modeling. The inventory turnover ratio can be manipulated to give inventory turnover days instead. This is done by taking the inverse of the ratio and multiplying it by the number of days in the time period.
For example, take the following information:
- Cost of Goods Sold: $300,000
- Average Inventory: $60,000
- # of Days in Period: 365
With this, we calculate 60,000/300,000*365 = 73 days. This means that on average, it takes 73 days for the company to sell an entire stock of inventory. However, an alternative use is that we can make assumptions on inventory turnover days to forecast future inventory.
For example, consider a company who consistently has inventory turnover days of around 62. This company has no plans to expand warehouse operations. Thus, it is relatively safe to assume that inventory held will not change and that inventory turnover days will remain constant into the future. Using the forecast numbers, we can manipulate the formula into Average Inventory = Inventory Turnover Days*Cost of Goods Sold/365. This would allow us to calculate the average inventory and thus the inventory for the forecast year.
Additionally, by knowing how quickly this company sells a stock of inventory, we can assess how well it meets market demand and how its sales compare to other companies. A higher inventory turnover ratio (or lower inventory days) shows efficiency in sales and cost savings from holding lower levels of inventory.
More Free Templates
For more resources, check out our business templates library to download numerous free Excel modeling, PowerPoint presentation and Word document templates.
Analyst Certification FMVA® Program
Below is a break down of subject weightings in the FMVA® financial analyst program. As you can see there is a heavy focus on financial modeling, finance, Excel, business valuation, budgeting/forecasting, PowerPoint presentations, accounting and business strategy.

A well rounded financial analyst possesses all of the above skills!
Additional Questions & Answers
CFI is the global institution behind the financial modeling and valuation analyst FMVA® Designation. CFI is on a mission to enable anyone to be a great financial analyst and have a great career path. In order to help you advance your career, CFI has compiled many resources to assist you along the path.
In order to become a great financial analyst, here are some more questions and answers for you to discover:
- What is Financial Modeling?
- How Do You Build a DCF Model?
- What is Sensitivity Analysis?
- How Do You Value a Business?
Excel Tutorial
To master the art of Excel, check out CFI’s Excel Crash Course, which teaches you how to become an Excel power user. Learn the most important formulas, functions, and shortcuts to become confident in your financial analysis.

Launch CFI’s Excel Crash Course now to take your career to the next level and move up the ladder!


