Get Certified for Financial Modeling (FMVA)®
Gain in-demand industry knowledge and hands-on practice that will help you stand out from the competition and become a world-class financial analyst.
Cash generated from operating activities of a business
Operating Cash Flow (OCF), also called cash flow from operations or cash flow from operating activities, is the amount of cash generated by the regular operating activities of a business over a specific period.
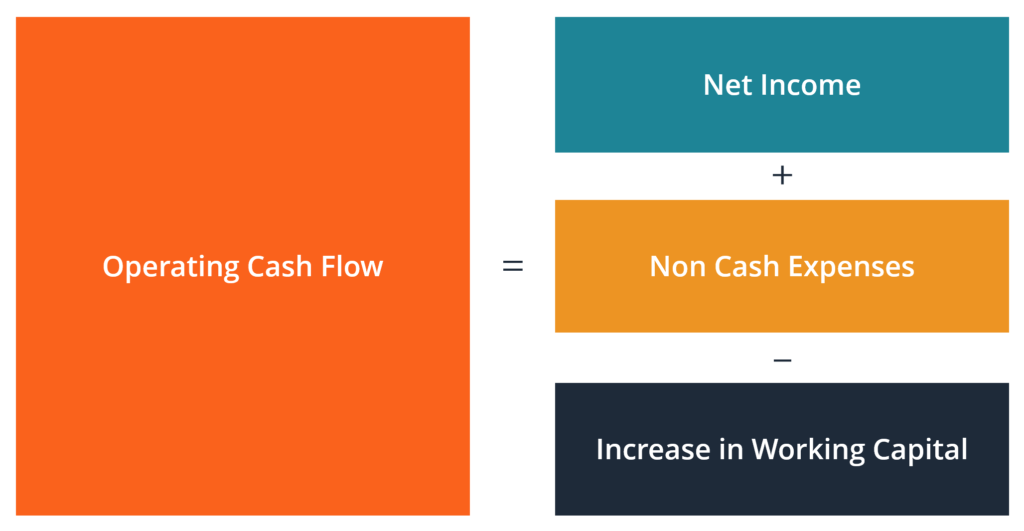
The formula for each company will be a little different, but the basic structure always consists of the same three elements: 1) OCF begins with net income, 2) adds back any non-cash items, and 3) adjusts for changes in net working capital. Summing these three elements together results in the total cash generated or consumed by operations in the period.
When performing financial analysis, operating cash flow should be used in conjunction with net income, free cash flow (FCF), and other metrics to properly assess a company’s performance and financial health.
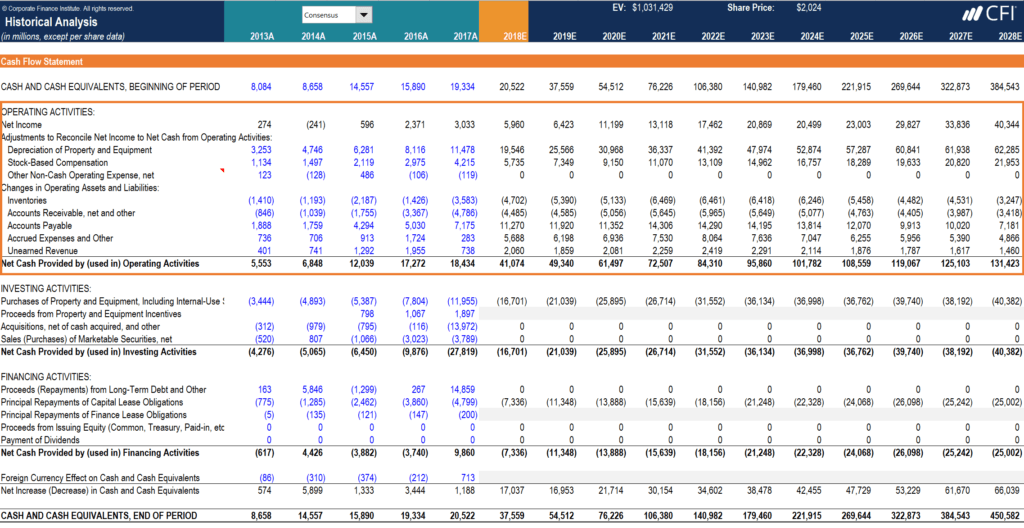
Below is an example of operating cash flow (OCF) using Amazon’s 2022 annual report.
As you can see, the consolidated statement of cash flows is organized into three distinct sections, with operating activities at the top, then investing activities, and finally, financing activities. In addition to those three sections, the statement also shows the starting cash balance, total change for the period, and ending balance.
Let’s analyze how the operating section works:
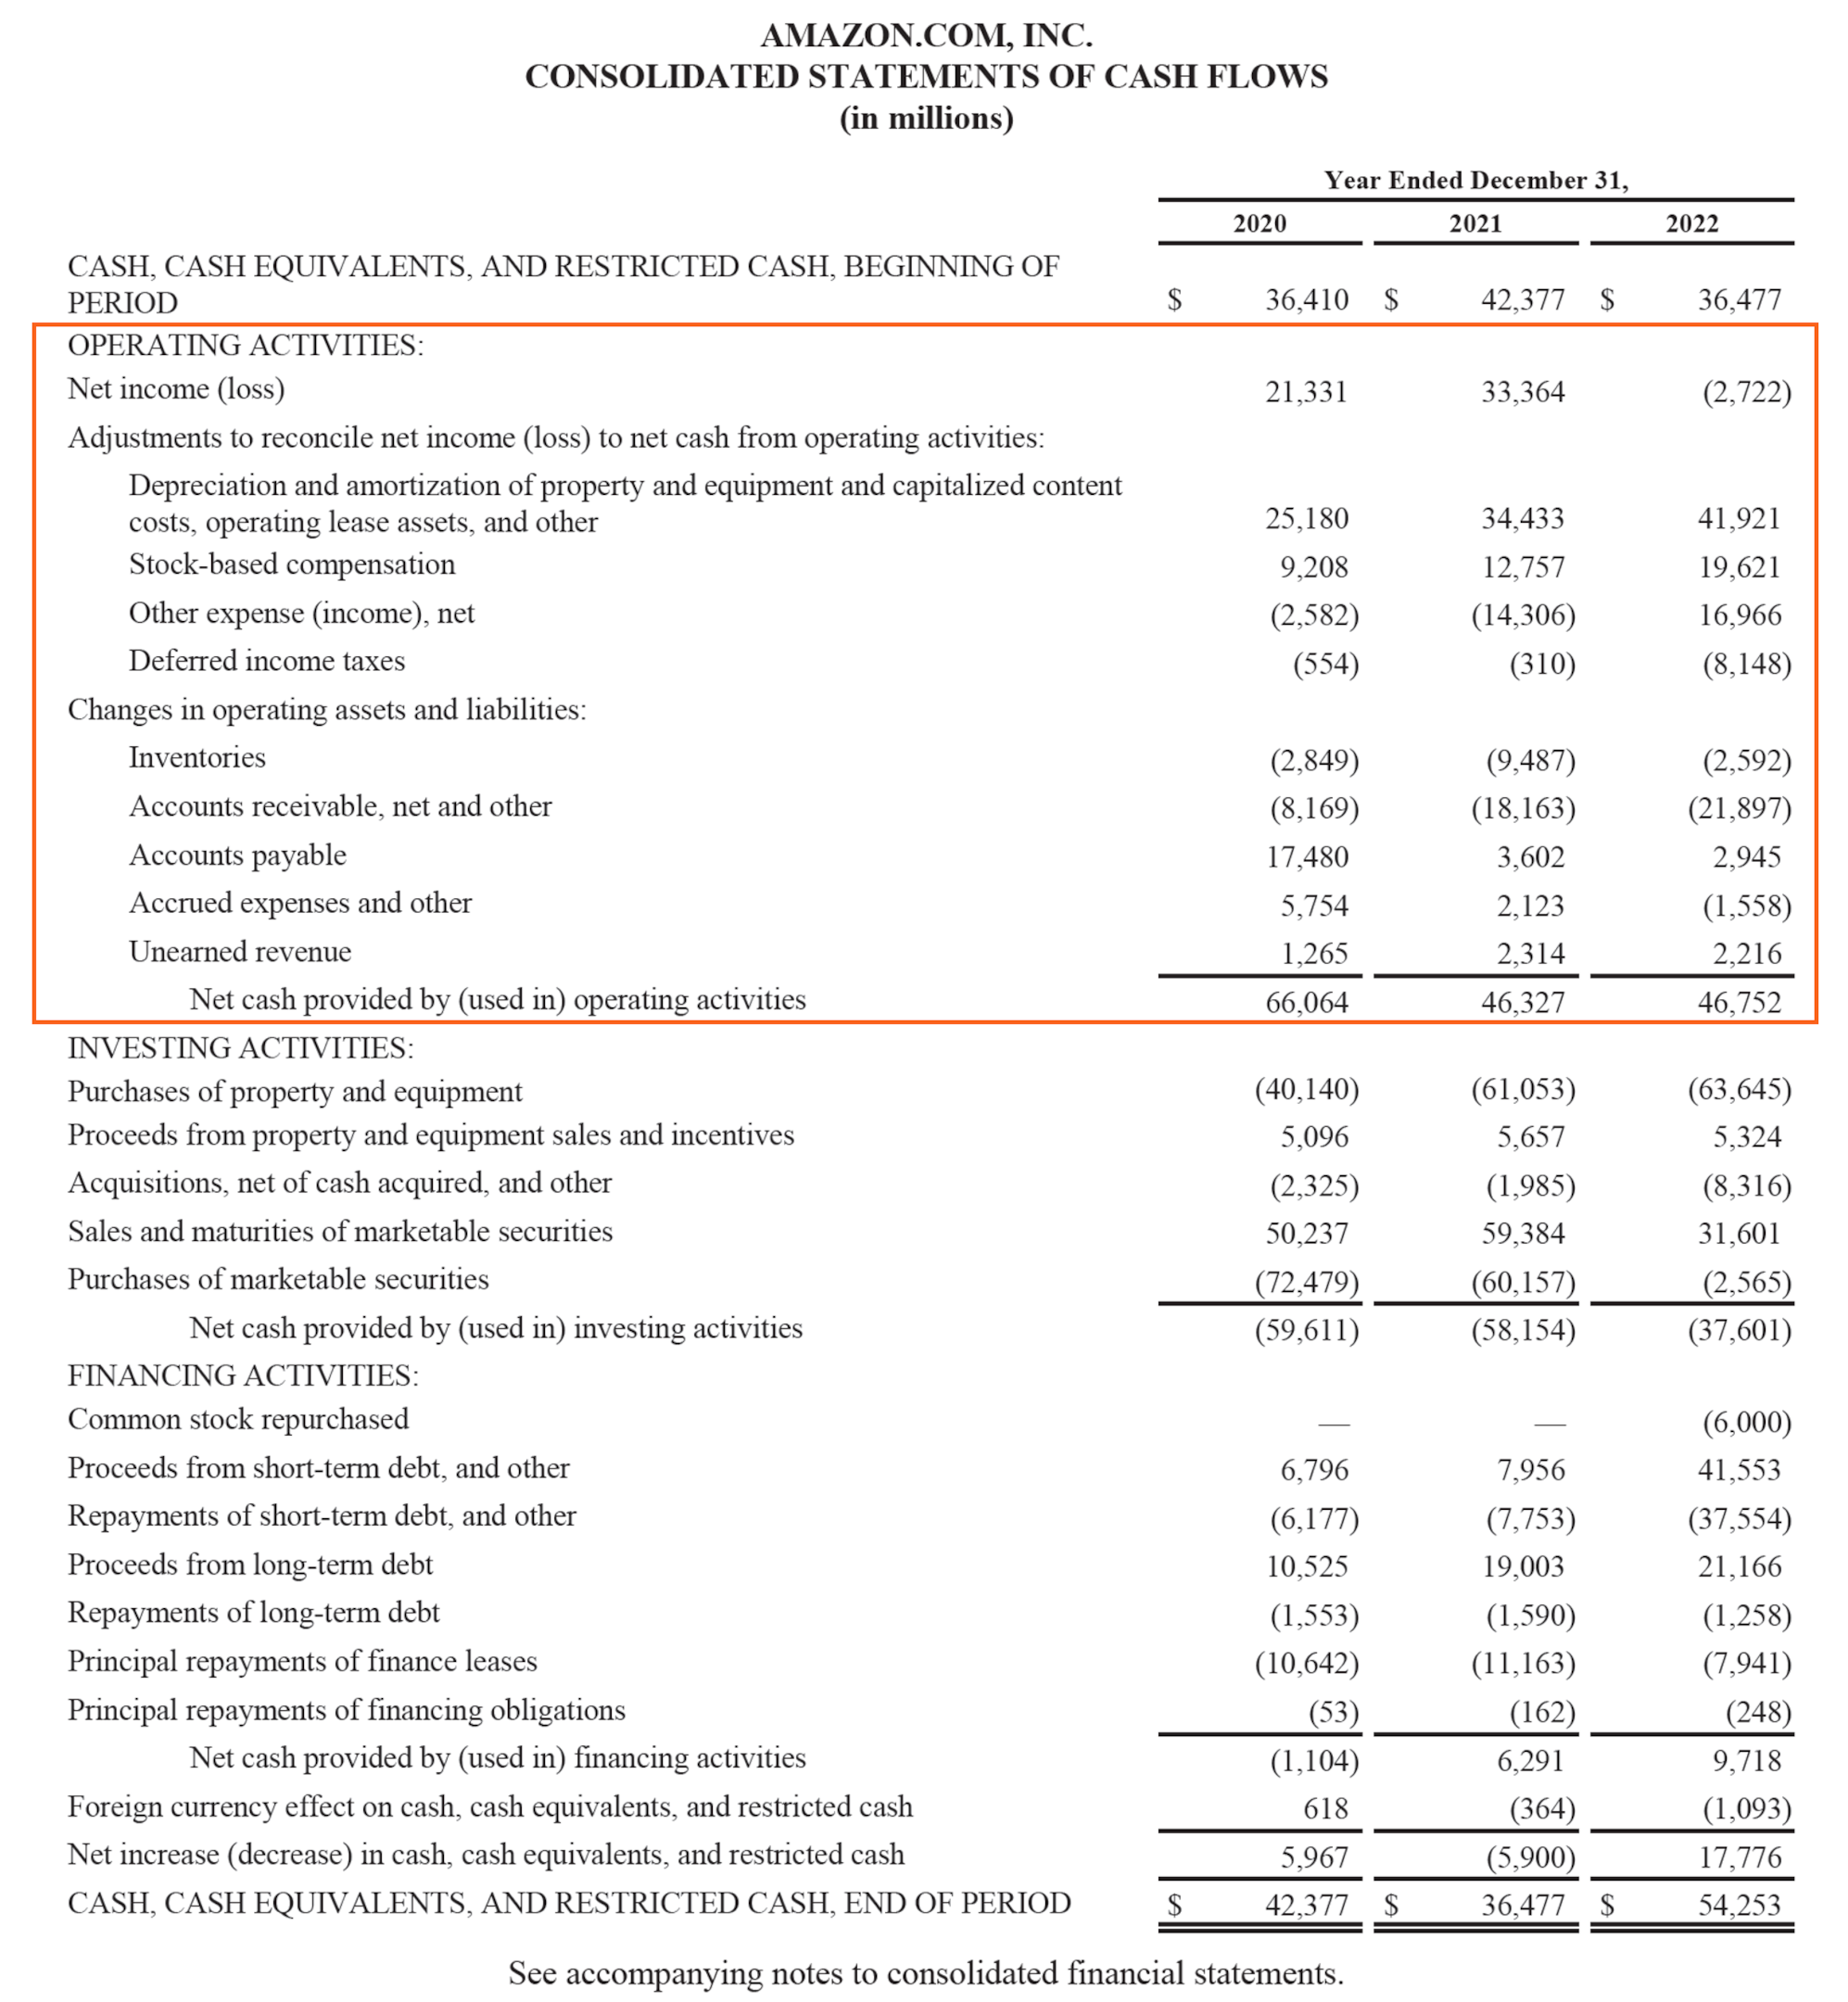
At the bottom of the operating cash flow section, we can see the total, which is labeled as “Net cash provided by (used in) operating activities.” The line is the sum of all items above it and represents the total for the period.
Whether you’re an accountant, a financial analyst, or a private investor, it’s important to know how to calculate how much cash flow was generated in a period. We sometimes take for granted when reading financial statements how many steps are actually involved in the calculation.
Let’s analyze the operating cash flow formula and each of the various components.
Formula (short form):
Using the short-form version of the operating cash flow formula, we can clearly see the three basic elements in every OCF calculation.
Formula (long form):
The formulas above are meant to give you an idea of how to perform the calculation on your own; however, they are not entirely exhaustive.
There can be additional non-cash items and additional changes in current assets or current liabilities that are not listed above. The key is to ensure that all items are accounted for, and this will vary from company to company.
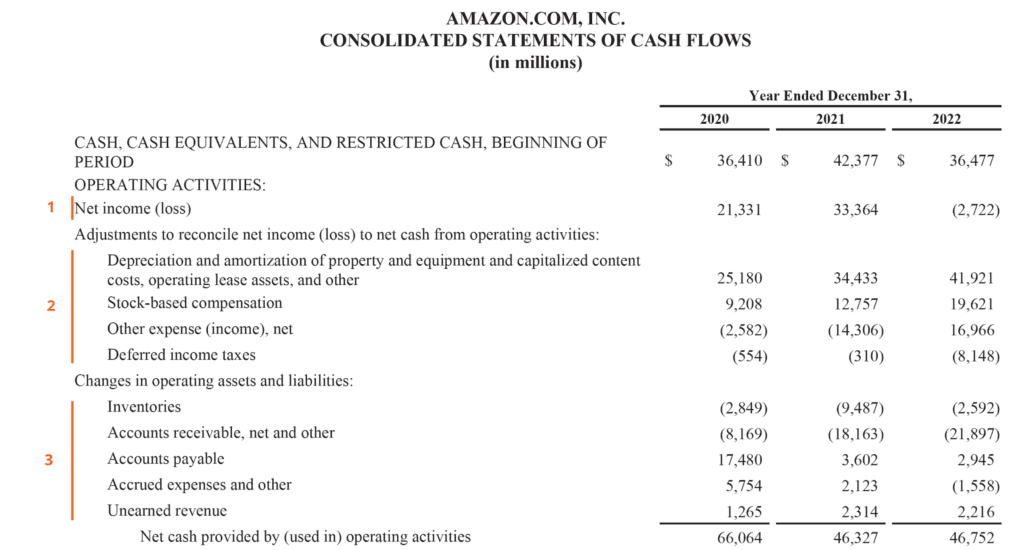
Net income and earnings per share (EPS) are two of the most frequently referenced financial metrics, so how are they different from operating cash flow? The main difference comes down to accounting rules such as the matching principle and the accrual principle when preparing financial statements.
Net income includes various sorts of expenses, some that may have actually been paid for and some that may have simply been created by accounting principles (such as depreciation).
In addition, a company’s revenue recognition principle and matching of expenses to the timing of revenues can result in a material difference between OCF and net income.
Unfortunately, it is not possible to simply say that one number is always higher or lower than the other. Sometimes, OCF is higher than net income (as with Amazon), and sometimes it’s the opposite.
As you can see in the screenshot above, there is a major difference between the two metrics, and Amazon has consistently generated more OCF than net income.
Let’s look at a simple example together from CFI’s Financial Modeling Course.
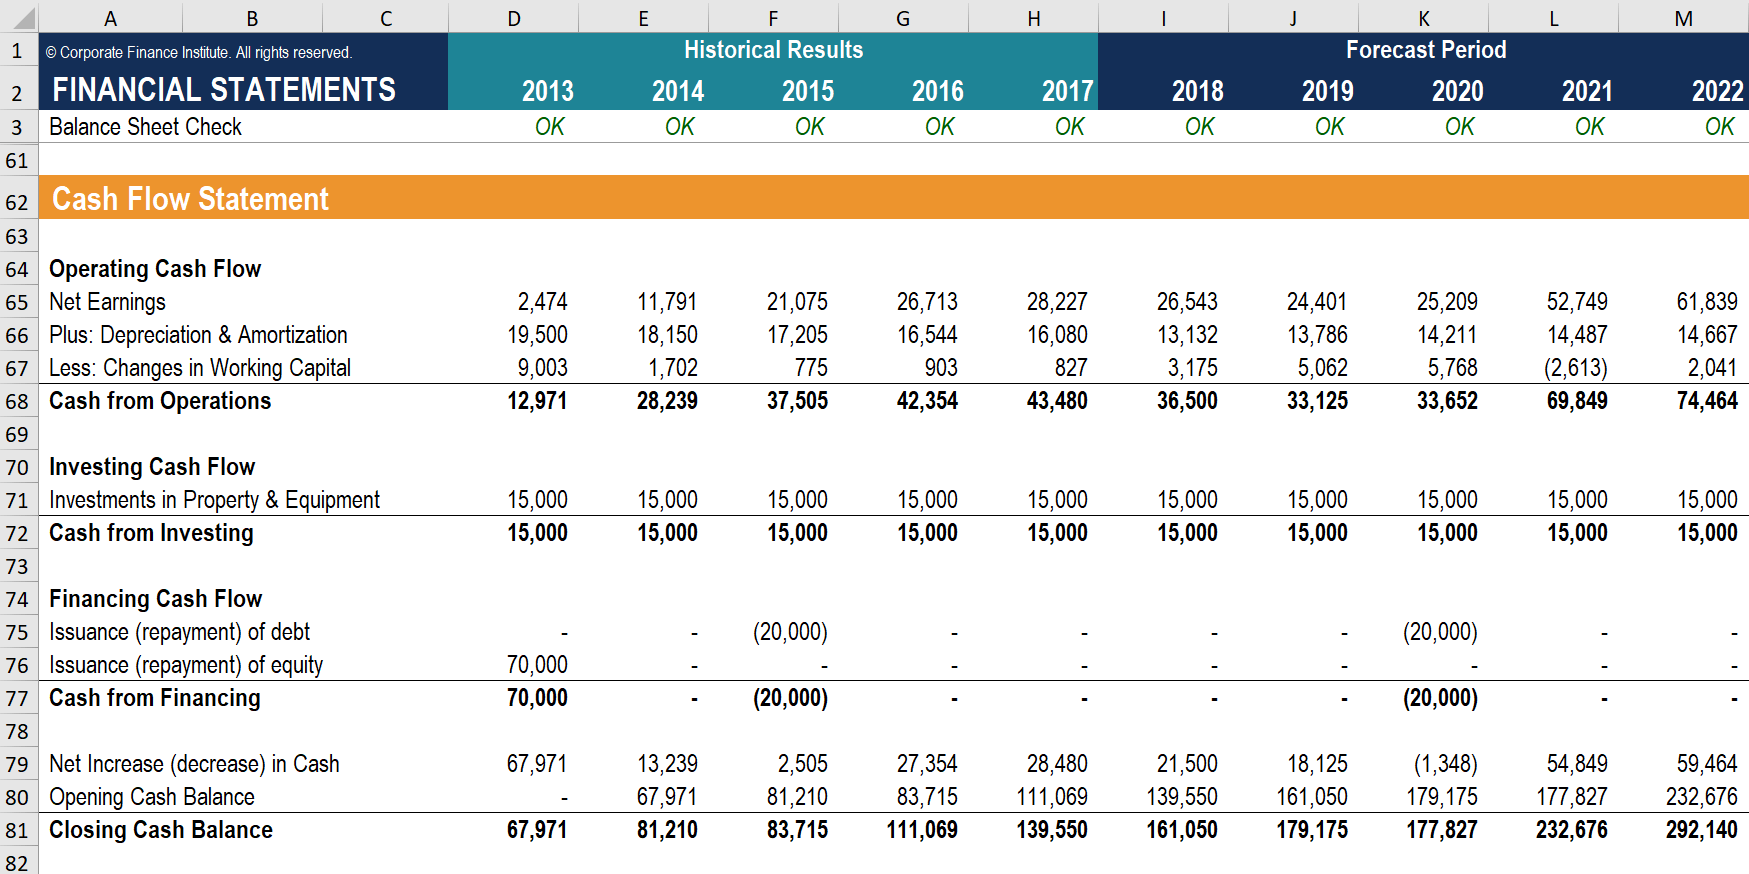
Step 1: Start calculating operating cash flow by taking net income from the income statement.
Step 2: Add back all non-cash items. In this case, depreciation and amortization is the only item.
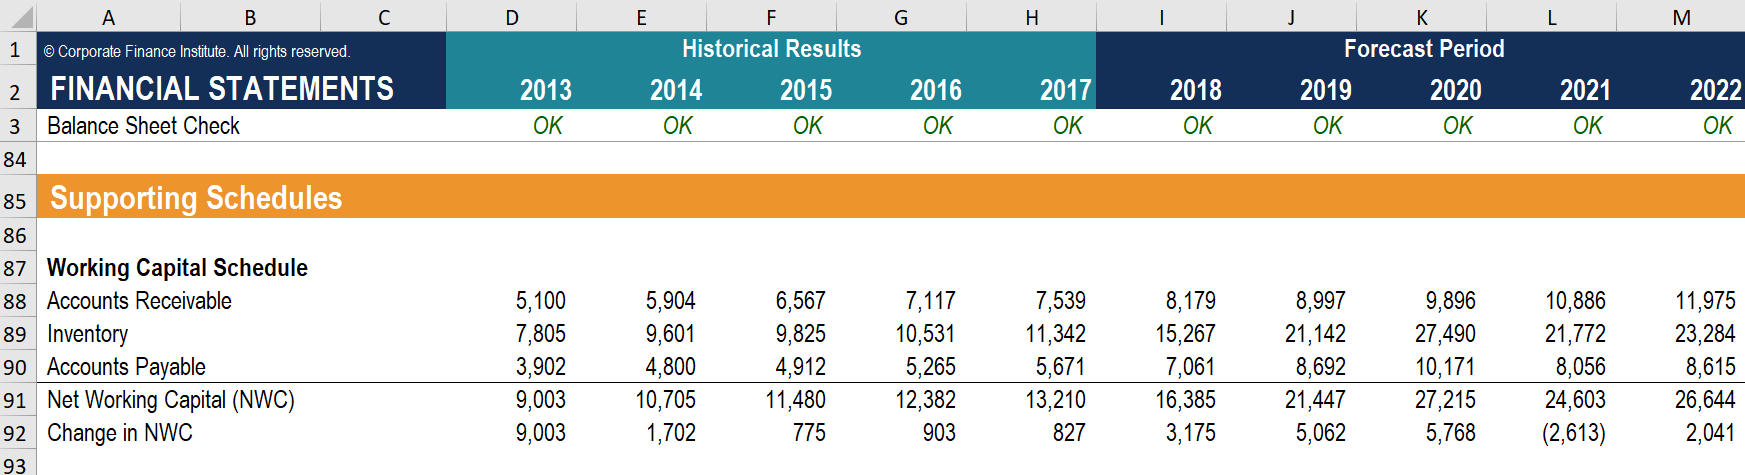
Step 3: Adjust for changes in working capital. In this case, there is only one line because the model has a separate section below that calculates the changes in accounts receivable, inventory, and accounts payable.
Earnings Before Interest, Taxes, Depreciation, and Amortization (EBITDA) is one of the most heavily quoted metrics in finance. Financial Analysts regularly use it when comparing companies using the ubiquitous EV/EBITDA ratio. Since EBITDA doesn’t include depreciation expense, it’s sometimes considered a proxy for cash flow.
Since EBITDA excludes interest and taxes, it can be very different from operating cash flow. Additionally, the impact of changes in working capital and other non-cash expenses can make it even more different.
Learn more in CFI’s Business Modeling Courses.
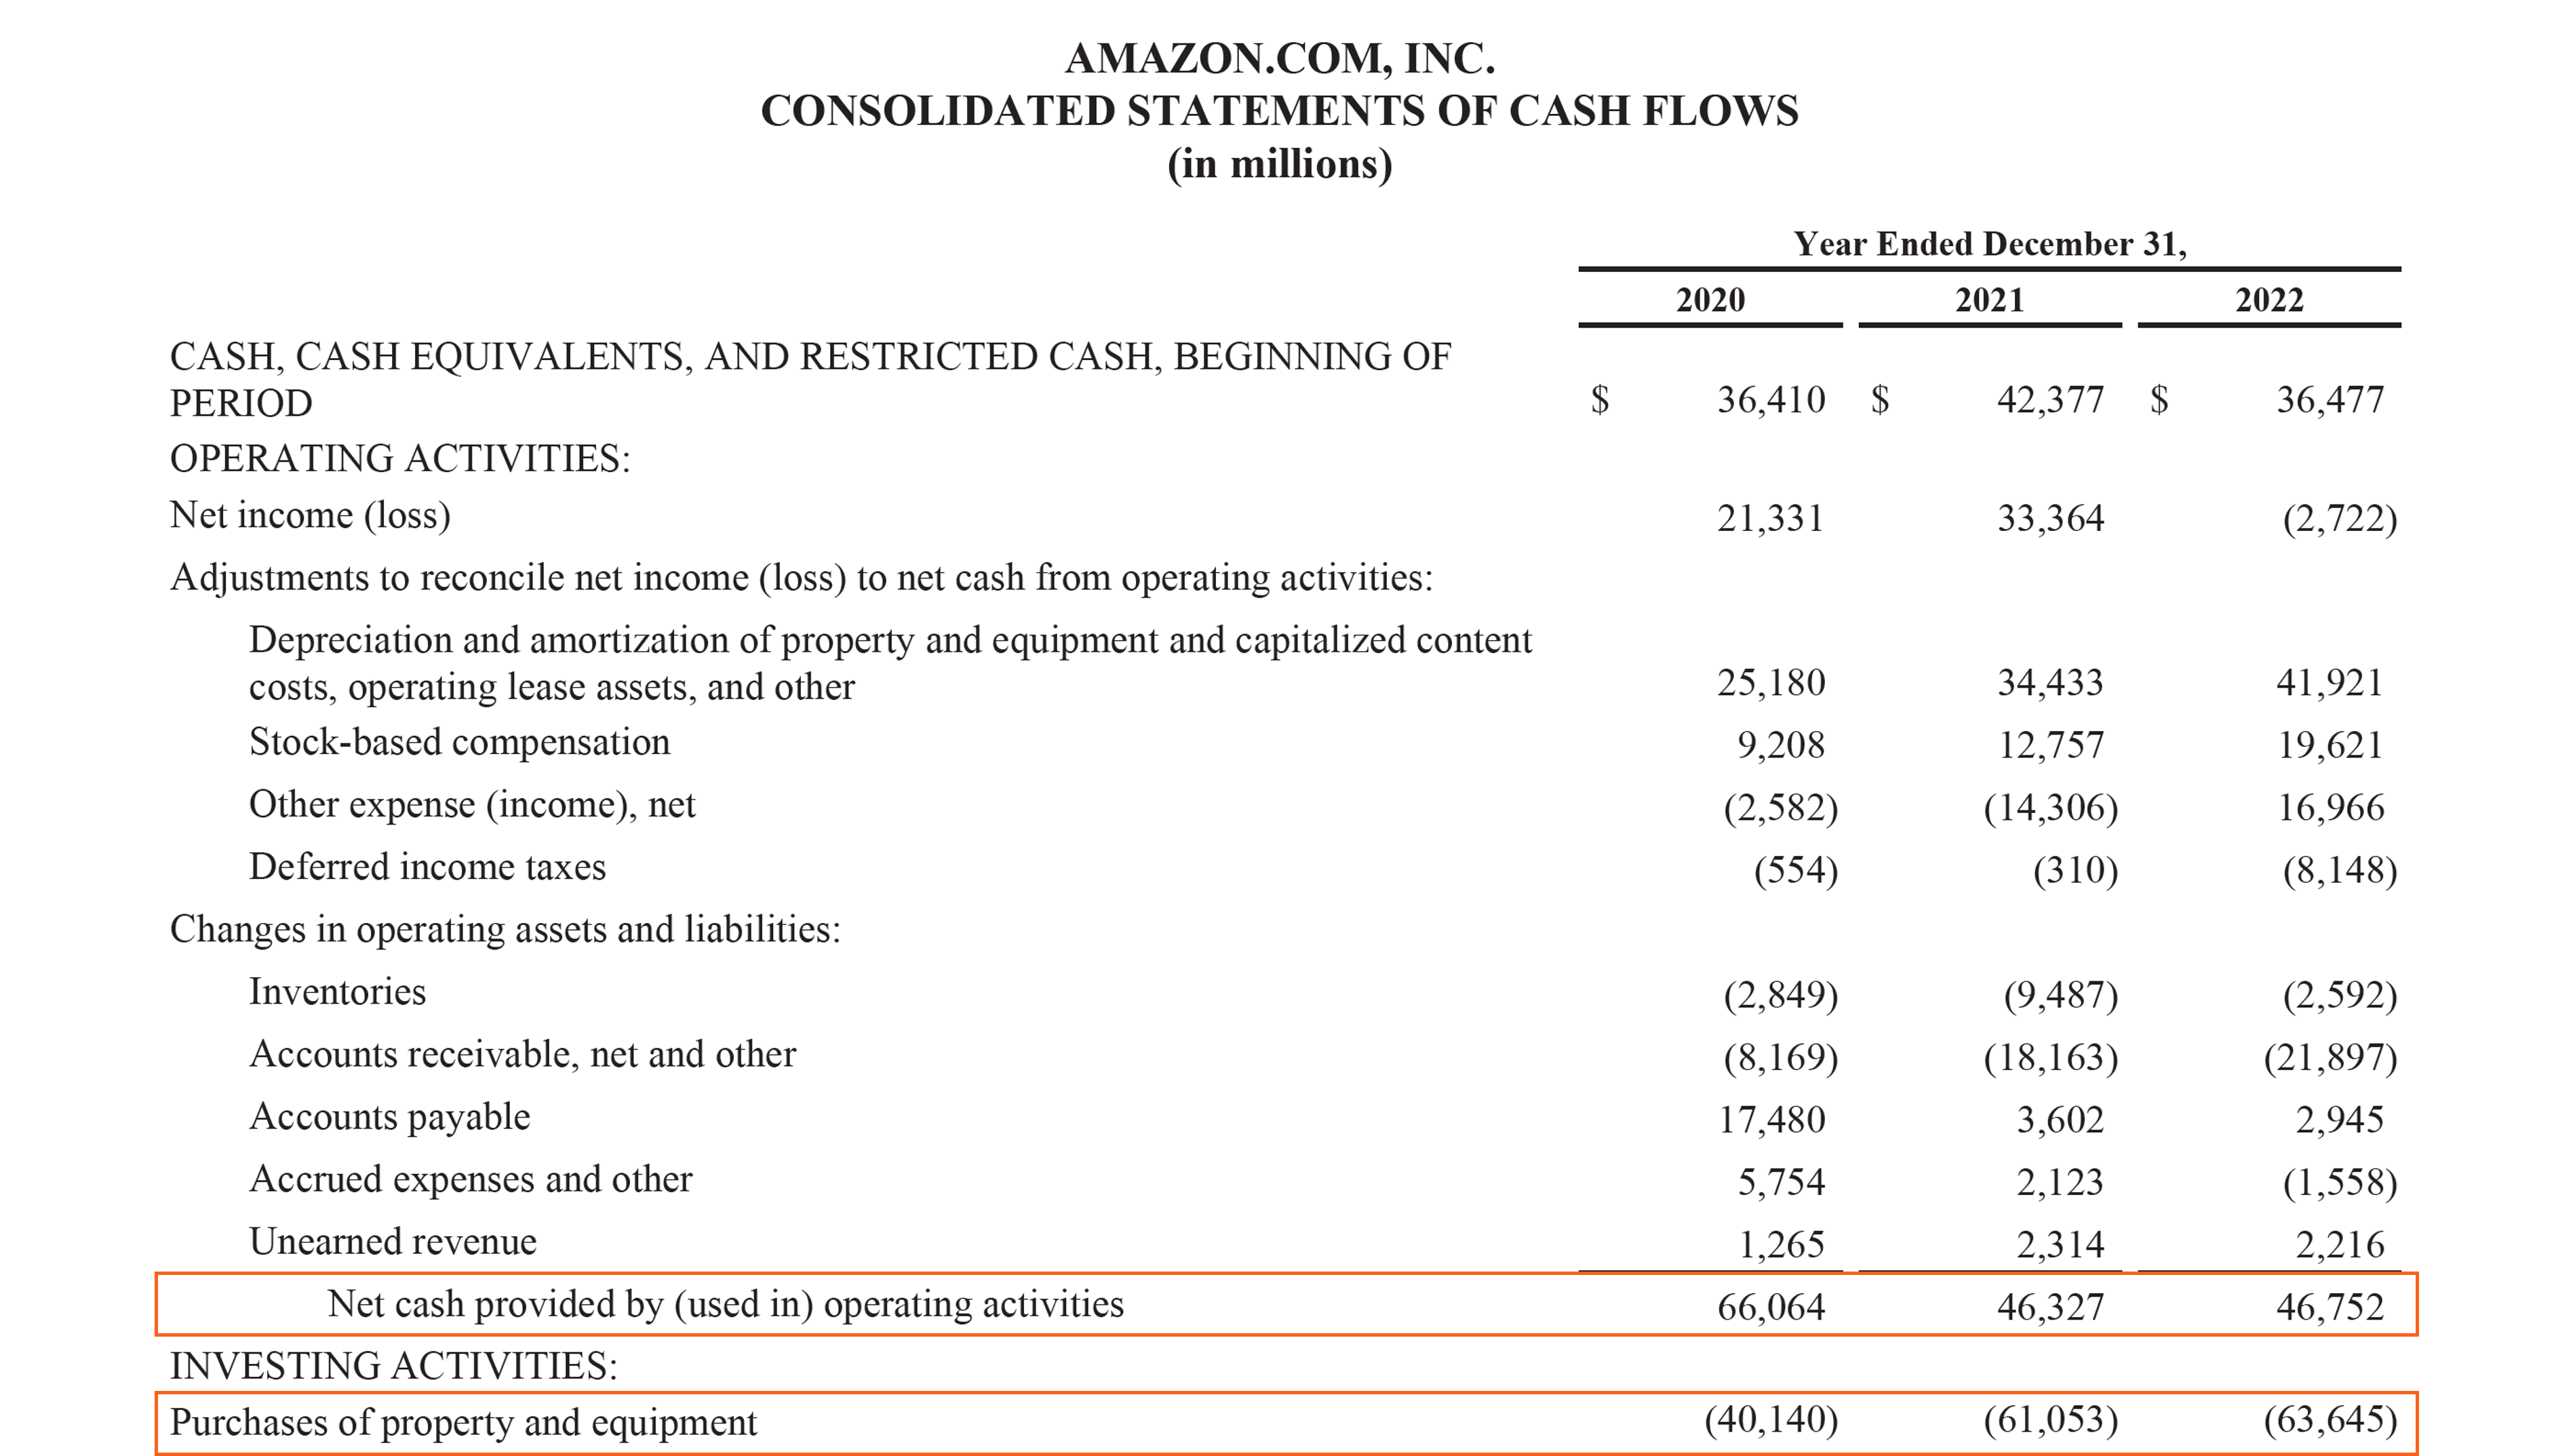
While operating cash flow tells us how much cash a business generates from its operations, it does not take into account any capital investments that are required to sustain or grow the business.
To get a complete picture of a company’s financial position, it is important to take into account capital expenditures (CapEx), which can be found under Cash Flow from Investing Activities.
Deducting capital expenditures from cash flow from operations gives us Free Cash Flow, which is often used to value a business in a discounted cash flow (DCF) model.
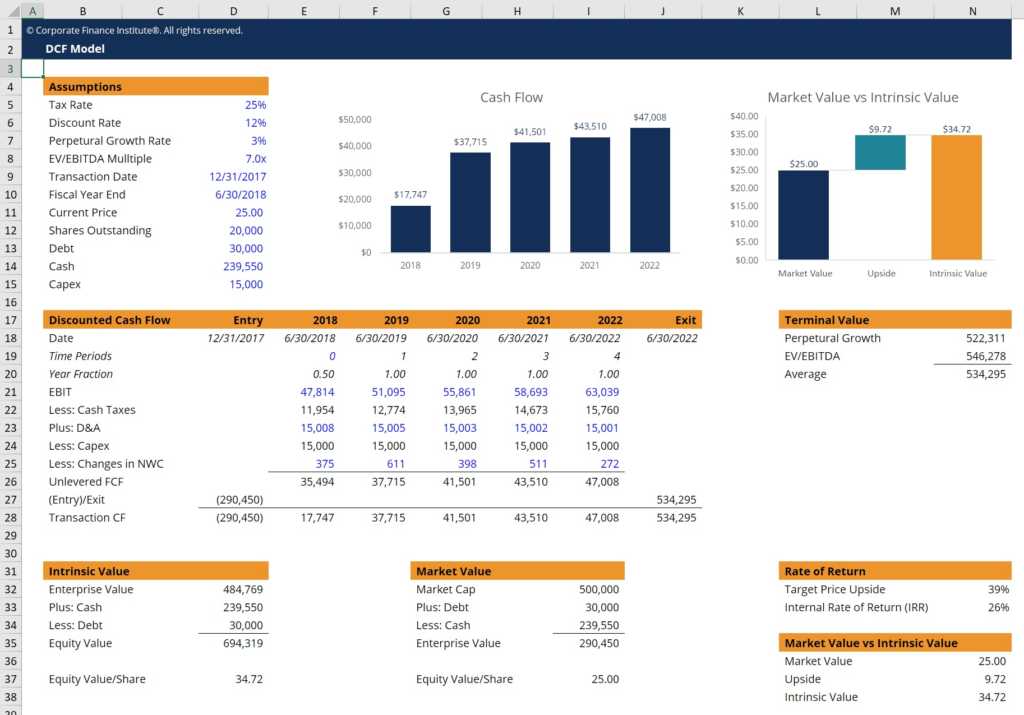
While the operating cash flow formula is great for assessing how much a company generates from operations, there is a major limitation: OCF doesn’t take into account capital expenditures (CapEx) or other long-term investments. By deducting CapEx from OCF, you arrive at Free Cash Flow, which is a better assessment of available cash generated for the period.
The FCF formula is:
Calculating the operating cash flow can be one of the most challenging parts of financial modeling in Excel. Below is an example of what this activity looks like in a spreadsheet.
As you can see in the screenshot below, there are various adjustments to items necessary to reconcile net income to net cash from operating activities, as well as changes in operating assets and liabilities.
In a financial model, there are separate sections for the depreciation schedule and working capital schedule, which then feed into the cash flow statement section of the model.
As you can see in the above example, there is a lot of detail required to model the operating activities section, and many of those line items require their own supporting schedules in a financial model.
The Operating Cash Flow Ratio, a liquidity ratio, is a measure of how well a company can pay off its current liabilities with the cash flow generated from its core business operations. This financial metric shows how much a company earns from its operating activities, per dollar of current liabilities.
Since earnings involve accruals and can be manipulated by management, the operating cash flow ratio is considered a very helpful gauge of a company’s short-term liquidity.
The formula for calculating the operating cash flow ratio is as follows:

Where:
The following information was taken out of Company A’s Q2 financial statements:

Therefore, the company earns $1.25 from operating activities per dollar of current liabilities. Alternatively, it can be viewed as, “Company A can cover its current liabilities 1.25x over.”
Enter your name and email in the form below and download our free Operating Cash Flow Ratio template now!
Companies with a high or uptrending operating cash flow are generally considered to be in good financial health.
Connect what you just learned to a clear career path with CFI’s role‑based courses and certification programs.
Thank you for reading this CFI guide to Operating Cash Flow. To continue learning and progressing in your career, these additional CFI resources will be helpful:


