Get Certified for Financial Modeling (FMVA)®
Gain in-demand industry knowledge and hands-on practice that will help you stand out from the competition and become a world-class financial analyst.
How to use a discount factor in financial models
In financial modeling, a discount factor is a decimal number multiplied by a cash flow value to discount it back to its present value. The factor increases over time (meaning the decimal value gets smaller) as the effect of compounding the discount rate builds over time.
Practically speaking, it is easier to use the XNPV function in Excel. However, a benefit of manually calculating the discount factor is that you can see what the present value of each individual cash flow is, as opposed to only the total NPV.
Enter your name and email in the form below and download our free Discount Factor Calculator now!
Some analysts prefer to calculate explicit discount factors in each time period so they can see the effects of compounding more clearly, as well as making the Discounted Cash Flow or DCF model easier to audit.
The discount factor is an alternative to using the XNPV or XIRR functions in Excel. In the example below, you will see exactly how it is used in a spreadsheet.
The formula for calculating the discount factor in Excel is the same as the Net Present Value (NPV formula).
The formula is as follows:
Factor = 1 / (1 x (1 + Discount Rate) ^ Period Number)
Here is an example of how to calculate the factor from our Excel spreadsheet template.
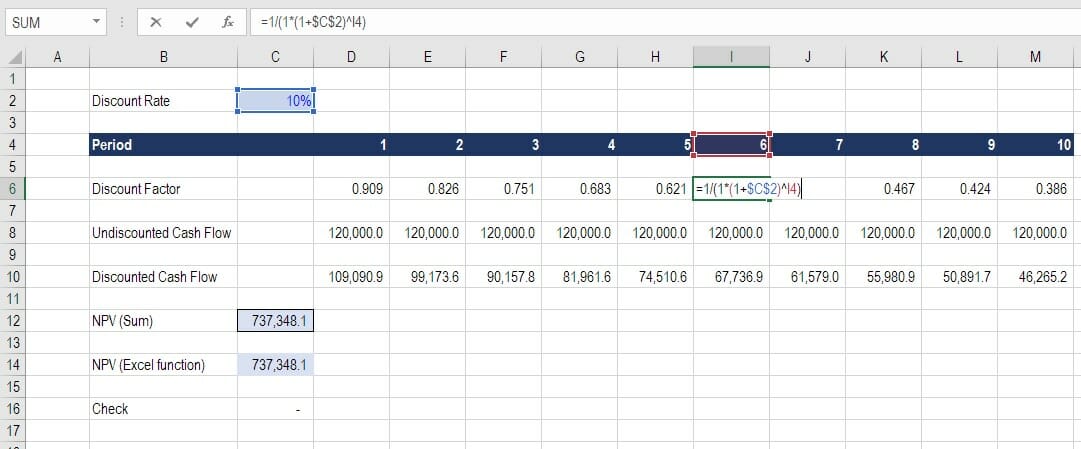
In period 6, which is year number 6 that we are discounting, the number in the formula would be as follows:
Factor = 1 / (1 x (1 + 10%) ^ 6) = 0.564
If the undiscounted cash flow in that period is $120,000, then to get the present value of that cash flow, we multiply it by 0.564, to arrive at $67,736.9.
The total NPV of the cash flows shown in the example above is $737,348.1, which can be calculated by summing up the individual discounted cash flows. We arrive at the same number as we do by using the NPV function in Excel.
Analysts will use discount factors when performing financial modeling in Excel if they want to have more visibility into the NPV formula and to better illustrate the effect of discounting.
As you see in the above example, every dollar of cash flow received in year 10 is only worth 38.6% of every dollar of cash flow received today. Once you get more than 15 to 20 years out, the value of cash flows becomes extremely discounted. As the risk of never receiving them becomes that much greater, the opportunity cost becomes that much higher.
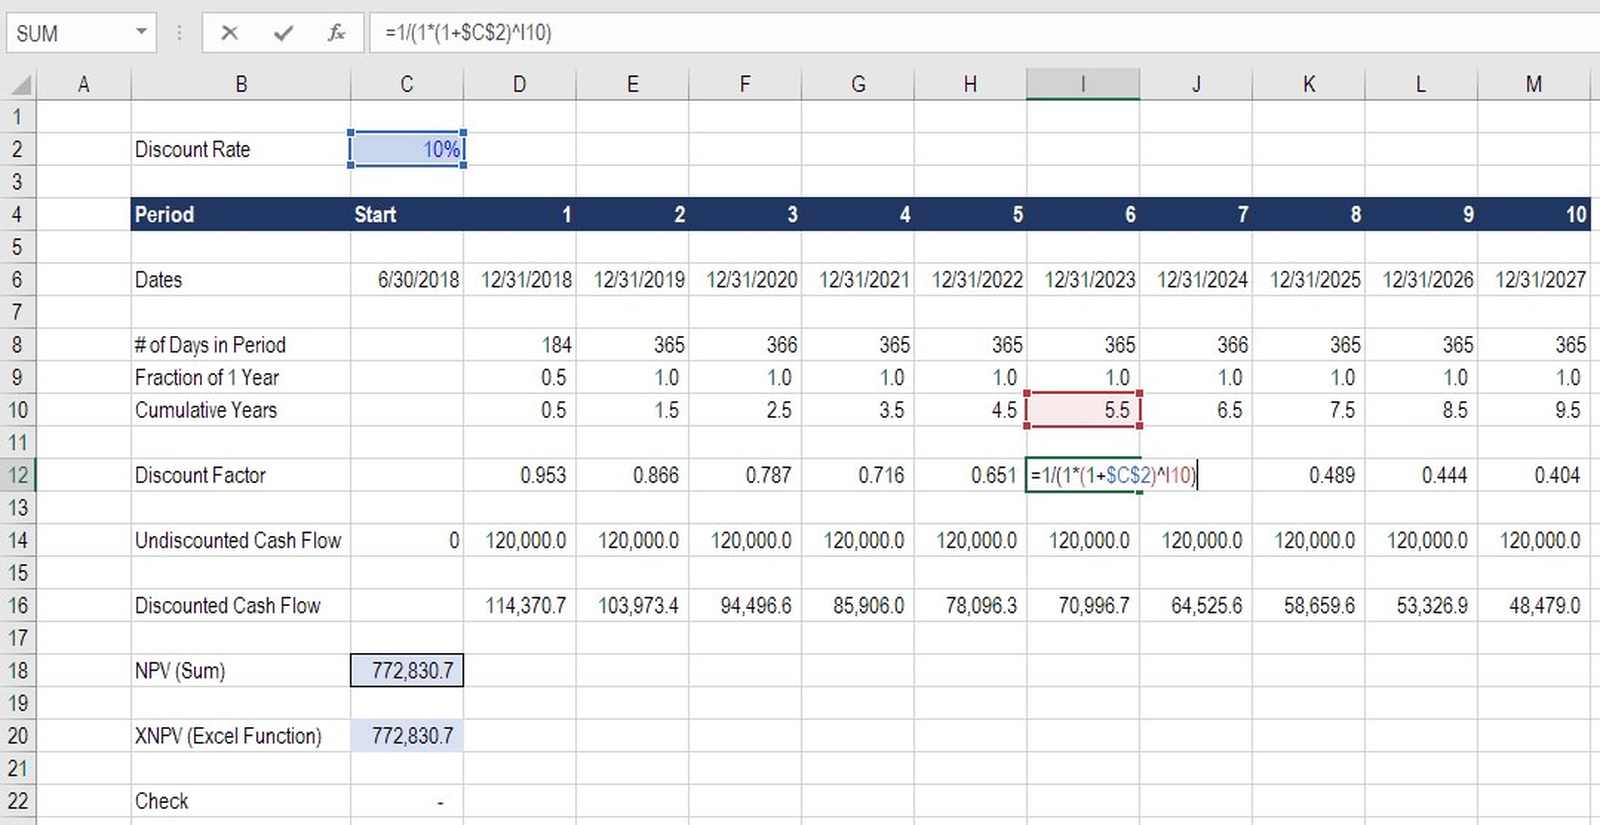
Using a discount factor allows you to specify exactly how many days are in each period. You can do this by using specific dates in each time period and taking the difference between them.
For example, June 30, 2018 to December 31, 2018 is 184 days, which is half a year. By adding this extra layer to the model, we can be very precise about our discounting periods. This achieves the exact same effect as using the XNPV function and XIRR function in Excel.
In order to keep developing your skills as a world-class financial analyst, we believe the following CFI resources will be extremely helpful for you:


