Get Certified for Financial Modeling (FMVA)®
Gain in-demand industry knowledge and hands-on practice that will help you stand out from the competition and become a world-class financial analyst.
How and why to use the function in financial analysis
The XNPV Function[1] in Excel uses specific dates that correspond to each cash flow being discounted in the series, whereas the regular NPV function automatically assumes all the time periods are equal. For this reason, the XNPV function is far more precise and should be used instead of the regular NPV function.
For additional learning, read CFI’s list of top Excel formulas.
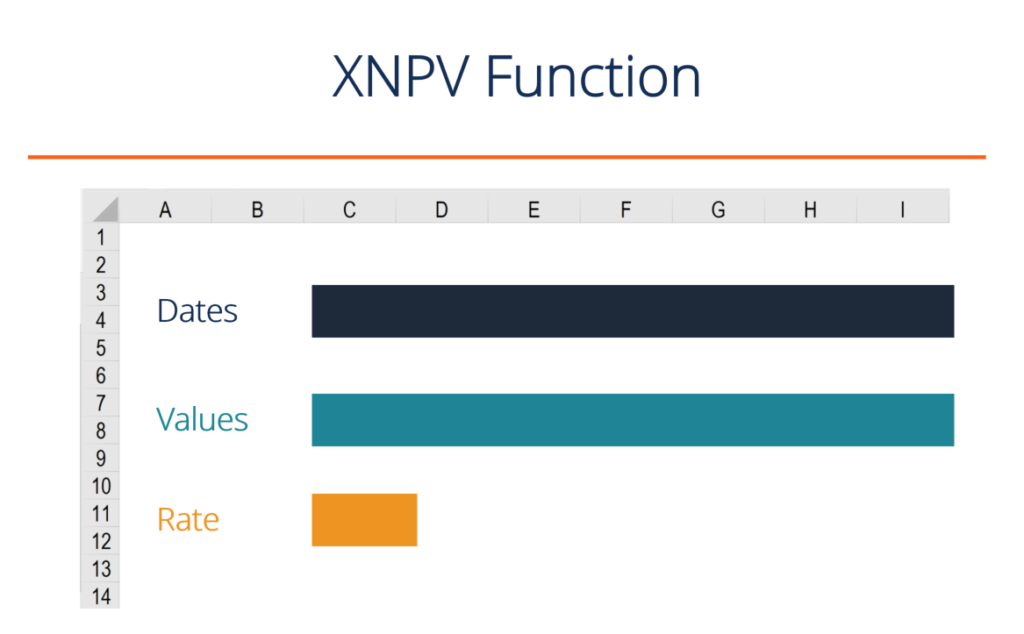
The XNPV formula in Excel requires the user to select a discount rate, a series of cash flows, and a series of corresponding dates for each cash flow.
The Excel formula for XNPV is:
=XNPV(Rate, Cash Flows, Dates of Cash Flow)
The XNPV function uses the following three components:
The XNPV function uses the following equation to calculate the Net Present Value of an investment:
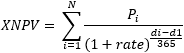
Where:
Please see the example below for a detailed breakdown of how to use XNPV in Excel.
Below is a screenshot of an Example of the XNPV function being used in Excel to calculate the Net Present Value of a series of cash flows based on specific dates.
Key assumptions in the XNPV example:
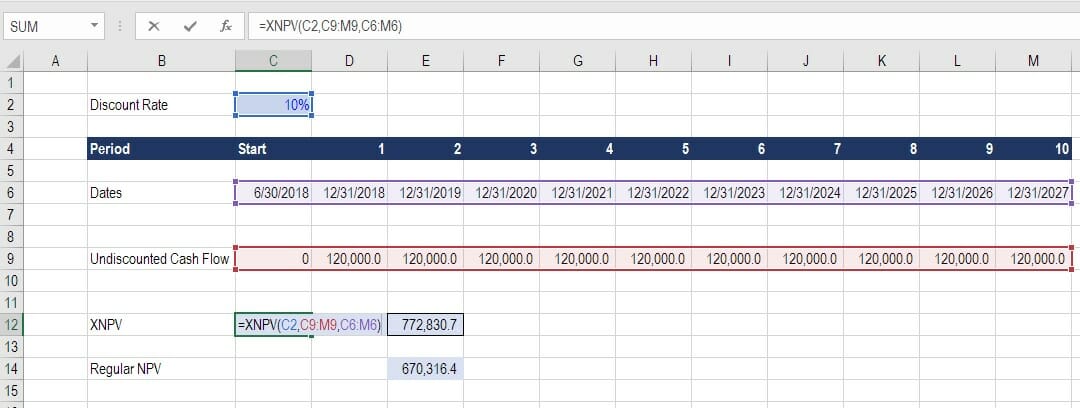
Based on the above, the XNPV formula produces a value of $772,830.7 while the regular NPV formula produces a value of $670,316.4.
The reason for this difference is that XNPV recognizes that the time period between the start date and the first cash flow is only 6 months, while the NPV function treats it as a full-time period.
If you’d like to incorporate this function in your own financial modeling and valuation work, please feel free to download CFI’s XNPV function template and use it as you see fit.
It may be a good idea to experiment with changing the dates around and seeing the impact on valuation, or the relative difference between XNPV vs NPV in the Excel model.
The results of the comparisons of XNPV vs NPV formulas produce an interesting result and some very important implications for a financial analyst. Imagine if the analyst were valuing a security and didn’t use the proper time periods that XNPV considers. They would be undervaluing the security by a meaningful amount!
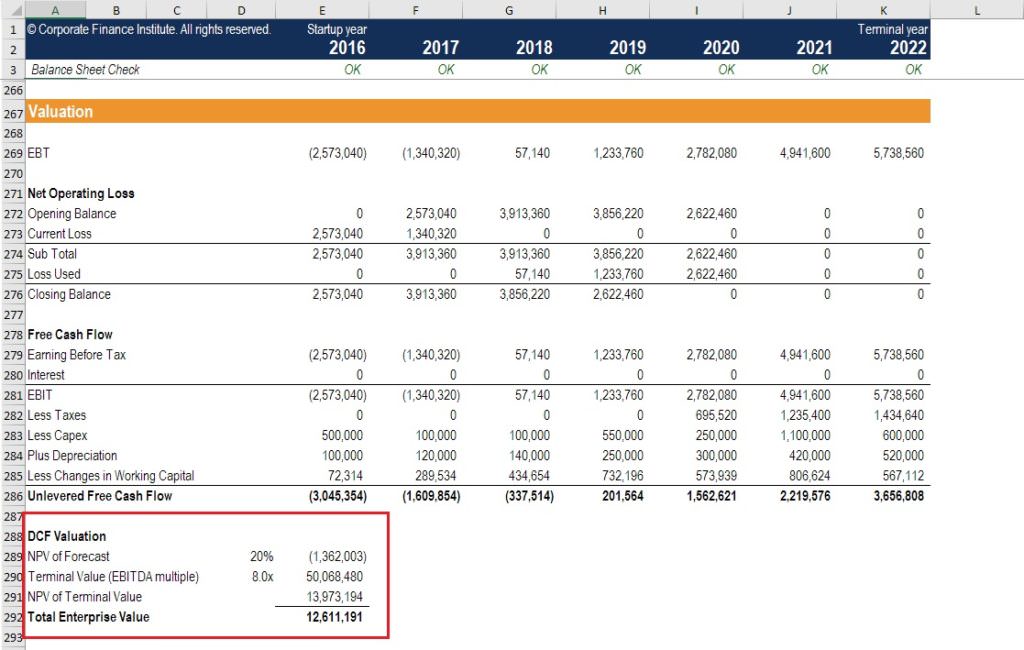
XNPV is used routinely in financial modeling to calculate the net present value (NPV) of an investment opportunity.
For all types of financial models, XNPV and XIRR are highly recommended over their date-less counterparts NPV and IRR.
While the added precision will have you feeling more confident about your analysis, the only downside is that you have to pay careful attention to the dates in your spreadsheet and make sure the start date always reflects what it should.
For a transaction such as a Leveraged Buyout (LBO) or an acquisition, it’s important to be precise about the closing date of the deal. For example, you may be building the model now, but the closing date will likely be several months in the future.
To see the function in action, check out CFI’s financial modeling courses!
Below is a helpful list of points to remember:
To learn more about XIRR vs IRR, we have created a similar guide, which we highly recommend you check out to further solidify the concept. For the same reasons as noted above in this guide, it’s equally important to use specific dates when calculating the internal rate of return on an investment.
If you’re considering a career in investment banking or private equity, you’ll need to use these functions extensively.
Connect what you just learned to a clear career path with CFI’s role‑based courses and certification programs.
We hope this has been a helpful guide to help you understand how to incorporate the important XNPV Excel function in your financial modeling.
To keep expanding your knowledge base and advancing your career as a Professional Financial Modeler, we believe these additional CFI resources will be helpful as well:


