LBO Model

The use of significant debt to acquire a company

Over 2 million + professionals use CFI to learn accounting, financial analysis, modeling and more. Unlock the essentials of corporate finance with our free resources and get an exclusive sneak peek at the first module of each course. Start Free

What is an LBO model?

An LBO model is a financial tool typically built in Excel to evaluate a leveraged buyout (LBO) transaction, which is the acquisition of a company that is funded using a significant amount of debt. Both the assets of a company being acquired and those of the acquiring company are used as collateral for the financing.

The buyer typically wishes to invest the smallest possible amount of equity and fund the balance of the purchase price with debt or other non-equity sources. The aim of the LBO model is to enable investors to properly assess the transaction and earn the highest possible risk-adjusted internal rate of return (IRR). Learn more in CFI’s LBO Modeling Course!

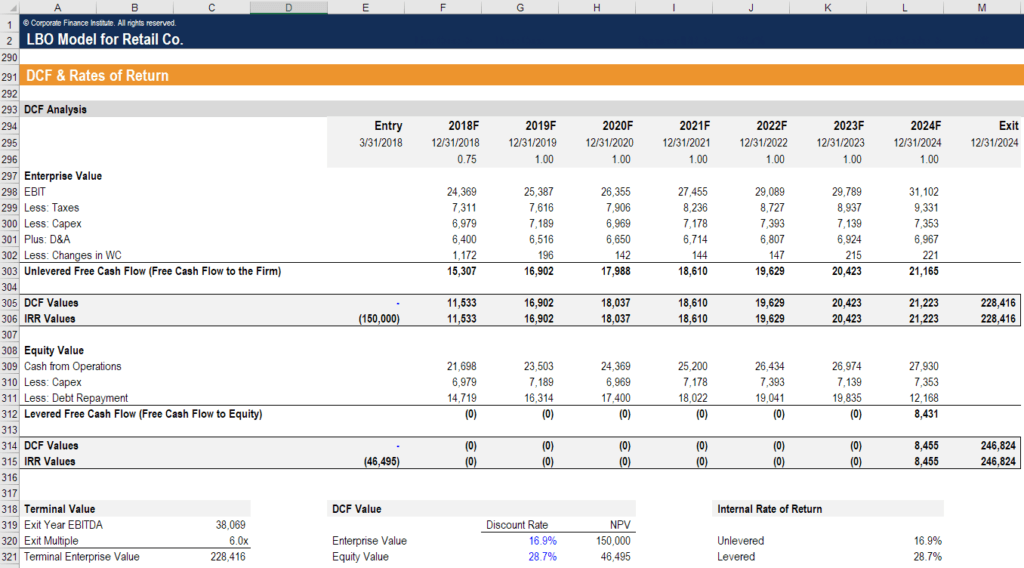
LBO Model - Screenshot

In an LBO, the goal of the investing company or buyer is to make high returns on their equity investment, using debt to increase the potential returns. The acquiring firm determines if an investment is worth pursuing by calculating the expected internal rate of return (IRR), where the minimum is typically considered 30% and above.

The IRR rate may sometimes be as low as 20% for larger deals or when the economy is unfavorable. After the acquisition, the debt/equity ratio is usually greater than 1-2x since the debt constitutes 50-90% of the purchase price. The company’s cash flow is used to pay the outstanding debt.

Structure of an LBO Model

In a leveraged buyout, the investors (private equity or LBO Firm) form a new entity that they use to acquire the target company. After a buyout, the target becomes a subsidiary of the new company, or the two entities merge to form one company.

Capital Structure in an LBO Model

Capital structure in a Leveraged Buyout (LBO) refers to the components of financing that are used in purchasing a target company. Although each LBO is structured differently, the capital structure is usually similar in most newly-purchased companies, with the largest percentage of LBO financing being debt. The typical capital structure is financing with the cheapest and less risky first, followed by other available options.

An LBO capital structure may include the following:

Bank Debt

Bank debt is also referred to as senior debt, and it is the cheapest financing instrument used to acquire a target company in a leveraged buyout, accounting for 50%-80% of an LBO’s capital structure. It has a lower interest rate than other financing instruments, making it the most preferred by investors.

However, bank debts come with covenants and limitations that restrict a company from paying dividends to shareholders, raising additional bank debts, and acquiring other companies while the debt is active. Bank debts typically come with a payback time of 5 to 10 years. If the company liquidates before the debt is fully paid, bank debts get paid off first.

High Yield Debt/Subordinated Debt

High yield debt is typically unsecured debt and carries a high interest rate that compensates the investors for risking their money. They have less restrictive limitations or covenants than there are in bank debts. In the event of a liquidation, high yield debt is paid before equity holders, but after the bank debt. The debt can be raised in the public debt market or private institutional market. Its payback period is typically 8 to 10 years, with a bullet repayment and early repayment options.

Mezzanine Debt

Mezzanine debt is a small middle layer in the LBO capital structure that is a hybrid of debt and equity and is junior or subordinate to other debt financing options. It is often financed by hedge funds and private equity investors and comes with a higher interest rate than bank debt and high-yield debt.

Mezzanine debt takes the form of a high yield debt with an option to purchase a stock at a specific price in the future as a way of boosting investor returns commensurate with the risk involved. It allows early repayment options and bullet payments just like high yield debt. During a liquidation, mezzanine debt is paid after other debts have been settled, but before equity shareholders are paid.

Equity

Equity comprises 20-30% of LBO financing, depending on the deal. It represents the private equity fund’s capital and attracts a high interest rate due to the risk involved. In the case of a liquidation, the equity shareholders are paid last, after all the debt has been settled. If the company defaults on payments, the equity shareholders may not receive any returns on their investments.

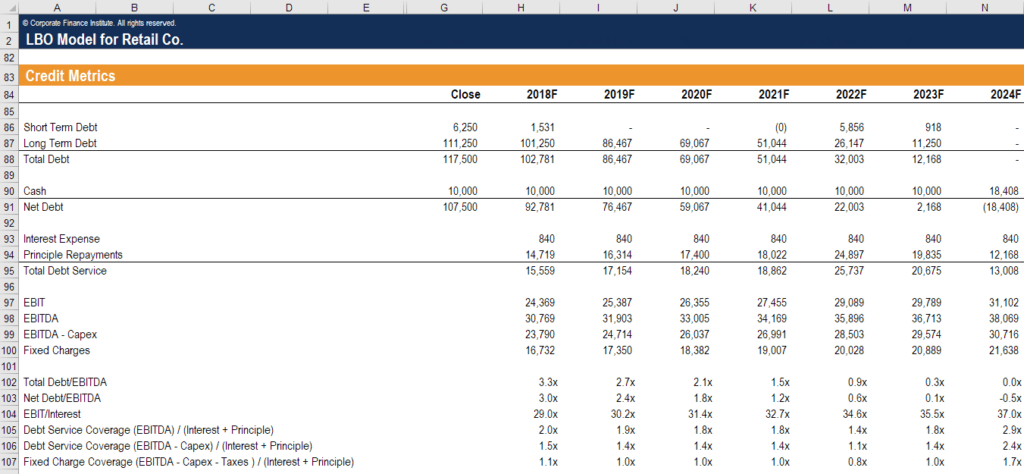
Credit Metrics

One of the keys to building an LBO model is making sure the credit metrics and debt covenants work for the deal. In the screenshot below, you will see how an analyst would model the credit metrics for this leveraged buyout.

Key credit metrics in an LBO model include:

LBO Model - Credit Metrics

Image Source: CFI’s LBO Model Course.

The private equity firm (aka, the financial sponsor) in the transaction will build the LBO model to determine how much debt they can strap on the business without blowing through the debt covenants and credit metrics they know the lenders will impose.

The ultimate goal of the model is to determine what the internal rate of return is for the sponsor (the private equity firm buying the business). Due to the high degree of leverage used in the transaction, the IRR to equity investors will be much higher than the return to debt investors.

The model will calculate both the levered and unlevered rates of return to assess how big the advantage of leverage is to the private equity firm.

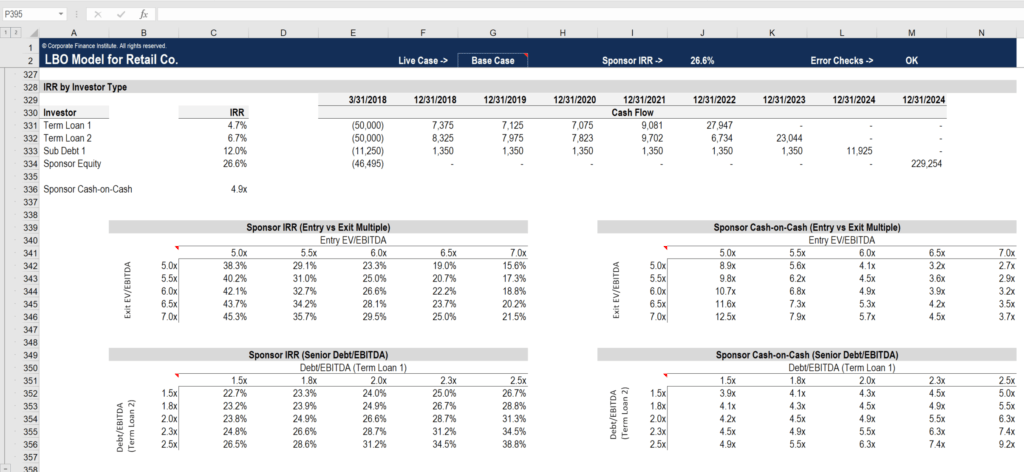
The sponsor’s IRR will usually be tested for a range of values in a process called sensitivity analysis, which calculates different outcomes as assumptions and inputs change. The most common assumptions to change are the EV/EBITDA acquisition multiple, the EV/EBITDA exit multiple, and the amount of debt used.

Below is an example of sensitivity analysis demonstrating the various IRRs and cash-on-cash returns, based on changes in assumptions.

LBO Model - Sensitivity Analysis

The above screenshot is from CFI’s LBO Model Training Course!

Learn More About Financial Modeling

Thank you for reading CFI’s guide to an LBO Model. To help you advance your career, check out the additional CFI resources below:

Additional Resources

CFI is a global provider of financial modeling courses and of the FMVA Certification. CFI’s mission is to help all professionals improve their technical skills. If you are a student or looking for a career change, the CFI website has many free resources to help you jumpstart your Career in Finance. If you are seeking to improve your technical skills, check out some of our most popular courses. Below are some additional resources for you to further explore:

The Financial Modeling Certification

0 search results for ‘