Get Certified for Financial Modeling (FMVA)®
Gain in-demand industry knowledge and hands-on practice that will help you stand out from the competition and become a world-class financial analyst.
The value of all future cash flows over an investment's entire life discounted to the present
Net Present Value (NPV) is the value of all future cash flows (positive and negative) over the entire life of an investment discounted to the present. NPV analysis is a form of intrinsic valuation and is used extensively across finance and accounting for determining the value of a business, investment security, capital project, new venture, cost reduction program, and anything that involves cash flow.
The formula for Net Present Value is:
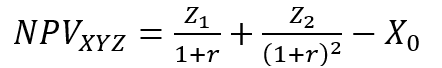
Where:
NPV analysis is used to help determine how much an investment, project, or any series of cash flows is worth. It is an all-encompassing metric, as it takes into account all revenues, expenses, and capital costs associated with an investment in its Free Cash Flow (FCF).
In addition to factoring all revenues and costs, it also takes into account the timing of each cash flow, which can result in a large impact on the present value of an investment. For example, it’s better to see cash inflows sooner and cash outflows later, compared to the opposite.
The cash flows in net present value analysis are discounted for two main reasons: (1) to adjust for the risk of an investment opportunity, and (2) to account for the time value of money (TVM).
The first point (to adjust for risk) is necessary because not all businesses, projects, or investment opportunities have the same level of risk. Put another way, the probability of receiving cash flow from a US Treasury bill is much higher than the probability of receiving cash flow from a young technology startup.
To account for the risk, the discount rate is higher for riskier investments and lower for a safer one. The US treasury example is considered to be the risk-free rate, and all other investments are measured by how much more risk they bear relative to that.
The second point (to account for the time value of money) is required because, due to inflation, interest rates, and opportunity costs, money is more valuable the sooner it’s received. For example, receiving $1 million today is much better than the $1 million received five years from now. If the money is received today, it can be invested and earn interest, so it will be worth more than $1 million in five years’ time.
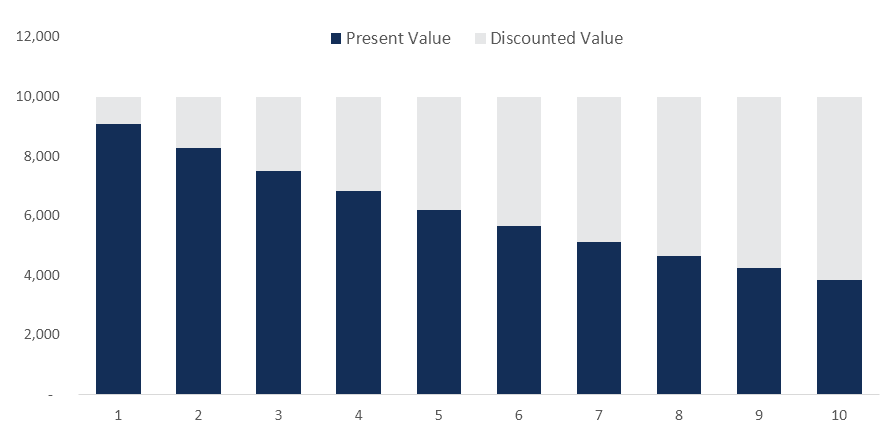
Let’s look at an example of how to calculate the net present value of a series of cash flows. As you can see in the screenshot below, the assumption is that an investment will return $10,000 per year over a period of 10 years, and the discount rate required is 10%.
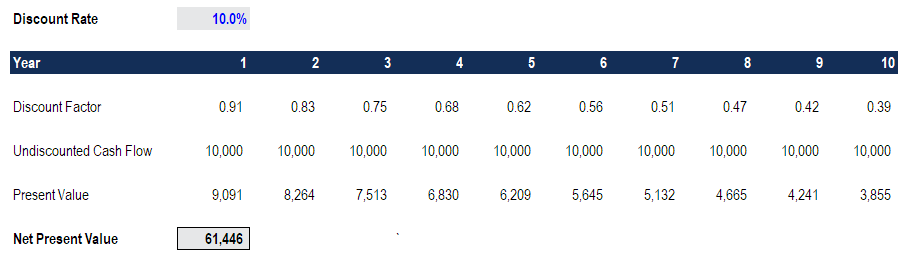
The final result is that the value of this investment is worth $61,446 today. It means a rational investor would be willing to pay up to $61,466 today to receive $10,000 every year over 10 years. By paying this price, the investor would receive an internal rate of return (IRR) of 10%. By paying anything less than $61,000, the investor would earn an internal rate of return that’s greater than 10%.
Click the button below to download our free Net Present Value (NPV) template now!
Excel offers two functions for calculating net present value: NPV and XNPV. The two functions use the same math formula shown above but save an analyst the time for calculating it in long form.
The regular NPV function =NPV() assumes that all cash flows in a series occur at regular intervals (i.e., years, quarters, month) and doesn’t allow for any variability in those time periods.
The XNPV function =XNPV() allows for specific dates to be applied to each cash flow so they can be at irregular intervals. The function can be very useful as cash flows are often unevenly spaced out, and this enhanced level of precision is required.
The internal rate of return (IRR) is the discount rate at which the net present value of an investment is equal to zero. Put another way, it is the compound annual return an investor expects to earn (or actually earned) over the life of an investment.
For example, if a security offers a series of cash flows with an NPV of $50,000 and an investor pays exactly $50,000 for it, then the investor’s NPV is $0. It means they will earn whatever the discount rate is on the security. Ideally, an investor would pay less than $50,000 and therefore earn an IRR that’s greater than the discount rate.
Typically, investors and managers of businesses look at both NPV and IRR in conjunction with other figures when making a decision. Learn about IRR vs. XIRR in Excel.
If the net present value of a project or investment, is negative it means the expected rate of return that will be earned on it is less than the discount rate (required rate of return or hurdle rate). This doesn’t necessarily mean the project will “lose money.” It may very well generate accounting profit (net income), but since the rate of return generated is less than the discount rate, it is considered to destroy value. If the NPV is positive, it creates value.
To value a business, an analyst will build a detailed discounted cash flow DCF model in Excel. This financial model will include all revenues, expenses, capital costs, and details of the business.
Once the key assumptions are in place, the analyst can build a five-year forecast of the three financial statements (income statement, balance sheet, and cash flow) and calculate the free cash flow of the firm (FCFF), also known as the unlevered free cash flow.
Finally, a terminal value is used to value the company beyond the forecast period, and all cash flows are discounted back to the present at the firm’s weighted average cost of capital. To learn more, check out CFI’s free detailed financial modeling course.
To value a project is typically more straightforward than an entire business. A similar approach is taken, where all the details of the project are modeled into Excel, however, the forecast period will be for the life of the project, and there will be no terminal value. Once the free cash flow is calculated, it can be discounted back to the present at either the firm’s WACC or the appropriate hurdle rate.
While net present value (NPV) is the most commonly used method for evaluating investment opportunities, it does have some drawbacks that should be carefully considered.
Key challenges to NPV analysis include:
Connect what you just learned to a clear career path with CFI’s role‑based courses and certification programs.
Net Present Value (NPV) is the most detailed and widely used method for evaluating the attractiveness of an investment. Hopefully, this guide’s been helpful in increasing your understanding of how it works, why it’s used, and the pros/cons.
To continue advancing your career, check out these relevant resources:


