NPV Function
Get the Net Present Value (NPV) for periodic cash flows
What is the NPV Function?
The NPV Function[1] is an Excel Financial function that will calculate the Net Present Value (NPV) for a series of cash flows and a given discount rate. It is important to understand the Time Value of Money, which is a foundational building block of various Financial Valuation methods.
In financial modeling, the NPV function is useful in determining the value of an investment or understanding the feasibility of a project. It should be noted that it’s usually more appropriate for analysts to use the XNPV function instead of the regular NPV function.
Download free template now to advance your finance knowledge
Formula
=NPV(rate,value1,[value2],…)
The NPV function uses the following arguments:
- Rate (required argument) – This is the rate of discount over the length of the period.
- Value1, Value2 – Value1 is a required option. They are numeric values that represent a series of payments and income where:
- Negative payments represent outgoing payments.
- Positive payments represent incoming payments.
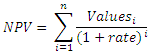
The NPV function uses the following equation to calculate the Net Present Value of an Investment:
How to Use the NPV Function in Excel
To understand the uses of the function, let’s consider a few examples:
Example – Using the Function
Suppose we are given the following data on cash inflows and outflows:
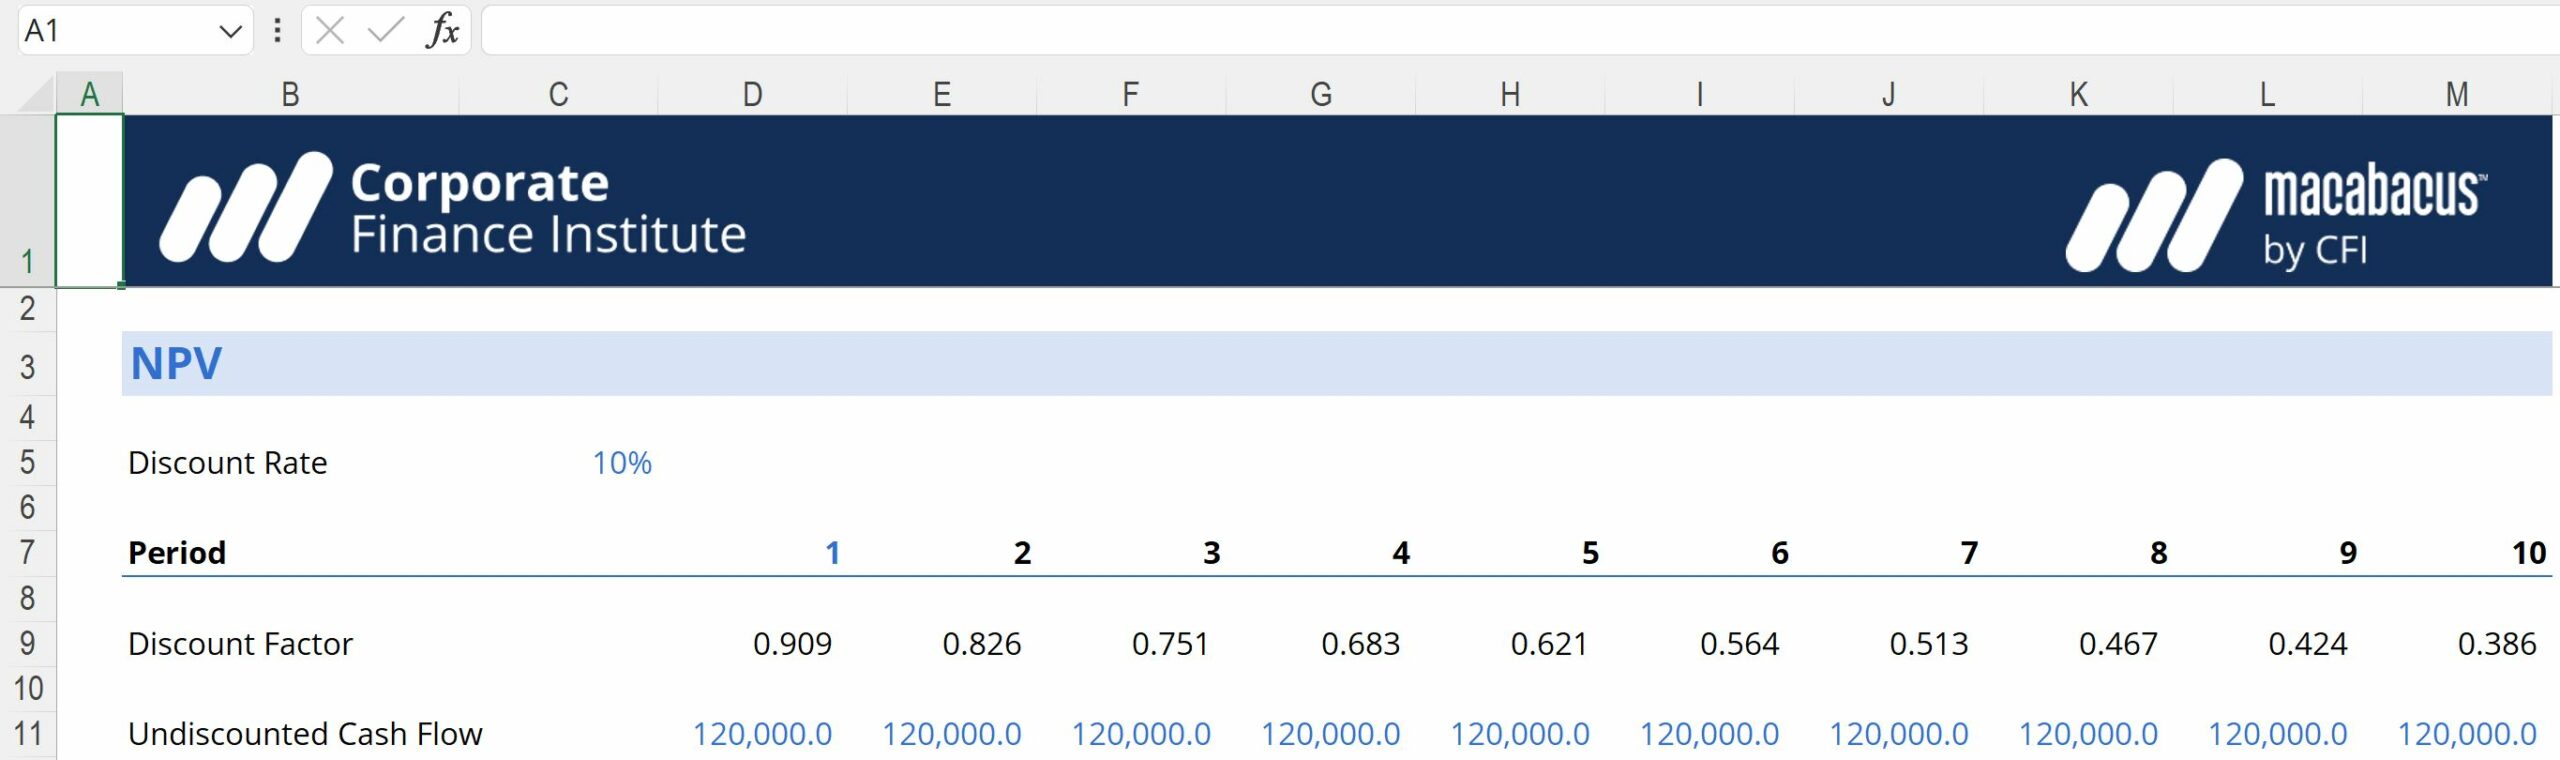
The required rate of return is 10%. To calculate the NPV, we will use the formula below:
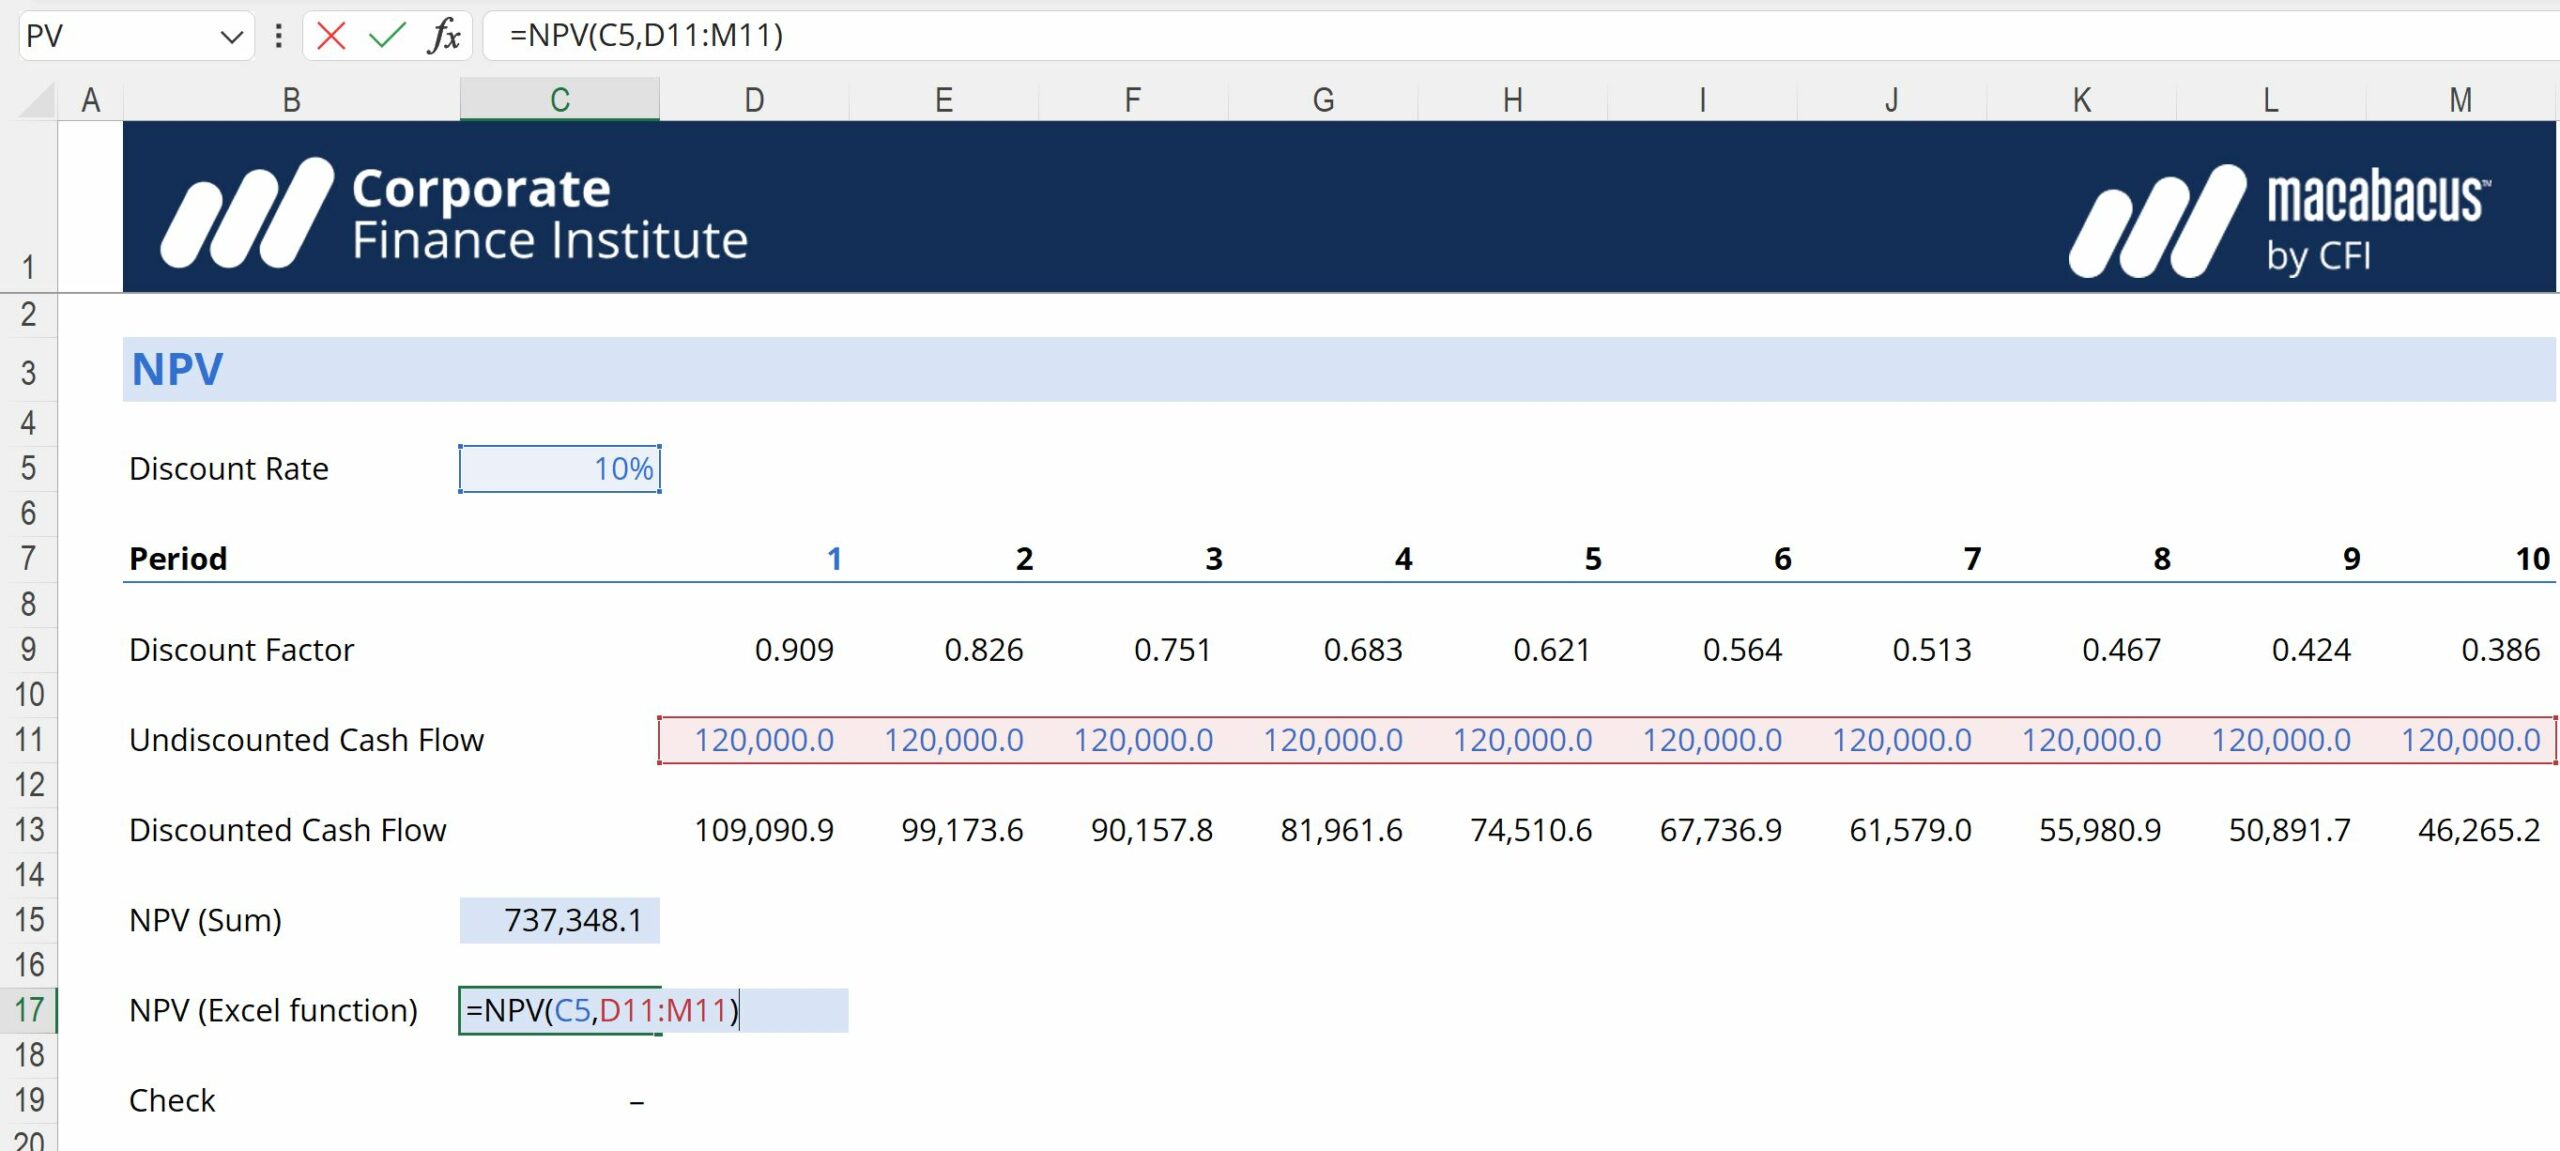
We get the result below:
The NPV formula is based on future cash flows. If the first cash flow occurs at the start of the first period, the first value must be added to the NPV result, not included in the values arguments.
Video Tutorial – NPV Function in Excel
To learn more about using the NPV Function in Excel, check out the video below:
Things to Remember About the NPV Function
- Arguments must be numerical or function with a numerical output. Other forms of input will result in an error.
- Arrays that are used as input will only have its numerical values evaluated. All other values in the array will be ignored.
- The input order matters for the series of cash flows.
- The NPV function assumes that payments are spaced on equal periodic payments.
- The NPV function and IRR function (Internal Rate of Return) are closely related. IRR is the rate for which the NPV equals zero.
Connect what you just learned to a clear career path with CFI’s role‑based courses and certification programs.
Additional Resources
Thanks for reading CFI’s guide to important Excel functions! By taking the time to learn and master these functions, you’ll significantly speed up your financial analysis. To learn more, check out these additional CFI resources:
- Excel Functions for Finance
- Advanced Excel Formulas Course
- Advanced Excel Formulas You Must Know
- Excel Shortcuts for PC and Mac
Article Sources
Excel Tutorial
To master the art of Excel, check out CFI’s Excel Crash Course, which teaches you how to become an Excel power user. Learn the most important formulas, functions, and shortcuts to become confident in your financial analysis.

Launch CFI’s Excel Crash Course now to take your career to the next level and move up the ladder!


