Get Certified for Financial Modeling (FMVA)®
Gain in-demand industry knowledge and hands-on practice that will help you stand out from the competition and become a world-class financial analyst.
Main methods of budget forecasting
There are four main types of forecasting methods that financial analysts use to predict future revenues, expenses, and capital costs for a business. While there is a wide range of frequently used quantitative budget forecasting tools, in this article, we focus on four main methods: (1) straight-line, (2) moving average, (3) simple linear regression, and (4) multiple linear regression.
| Straight Line | Constant growth rate | Minimum level | Historical data |
| Moving Average | Repeated forecasts | Minimum level | Historical data |
| Simple Linear Regression | Compare one independent with one dependent variable | Statistical knowledge required | A sample of relevant observations |
| Multiple Linear Regression | Compare more than one independent variable with one dependent variable | Statistical knowledge required | A sample of relevant observations |
The straight-line method is one of the simplest and easy-to-follow financial forecasting methods. A financial analyst uses historical figures and trends to predict future revenue growth.
In the example provided below, we will look at how straight-line forecasting is done by a retail business that assumes a constant sales growth rate of 4% for the next five years.
1. The first step in straight-line forecasting is to determine the sales growth rate that will be used to calculate future revenues. For 2016, the growth rate was 4.0% based on historical performance. We can use the formula =(C7-B7)/B7 to get this number. Assuming the growth will remain constant into the future, we will use the same rate for 2017 – 2021.
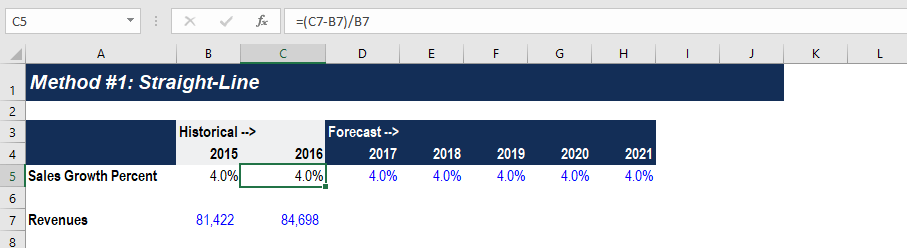
2. To forecast future revenues, take the previous year’s figure and multiply it by the growth rate. The formula used to calculate 2017 revenue is =C7*(1+D5).

3. Select cells D7 to H7, then use the shortcut Ctrl + R to copy the formula all the way to the right.
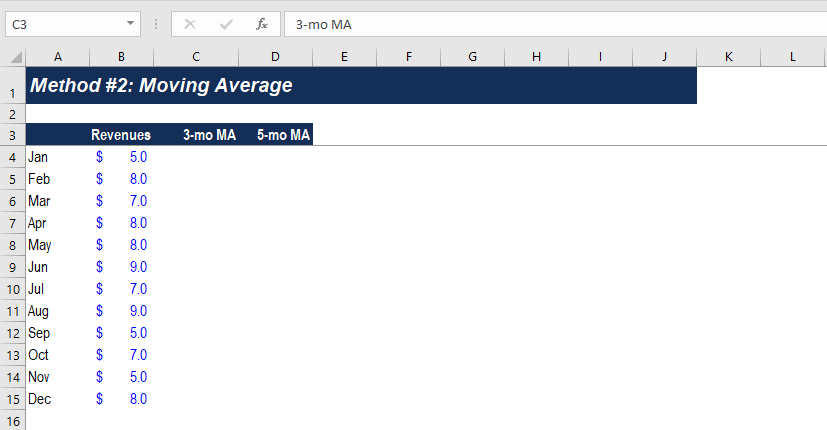
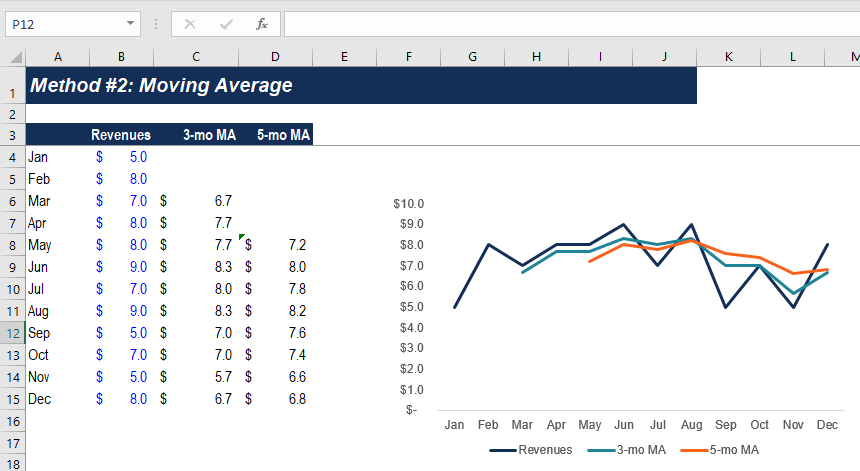
Moving averages are a smoothing technique that looks at the underlying pattern of a set of forecasting data to establish an estimate of future values. The most common types are the 3-month and 5-month moving averages.
1. To perform a moving average forecast, the revenue data should be placed in the vertical column. Create two columns: 3-month moving average and 5-month moving average.
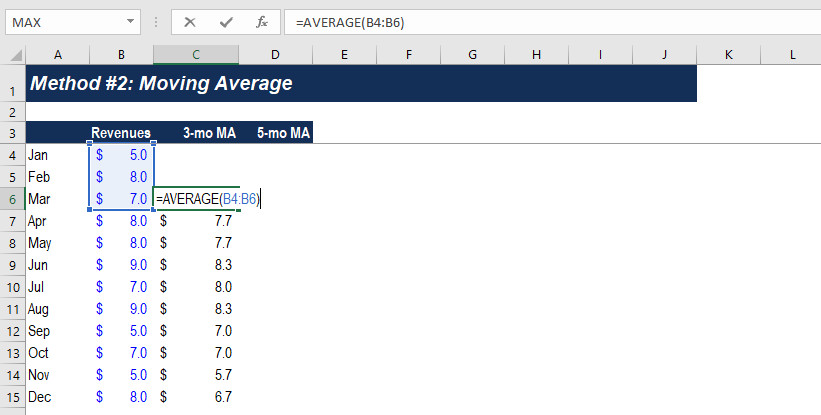
2. The 3-month moving average is calculated by taking the average of the current and past two months’ revenues. The first forecast should begin in March, which is cell C6. The formula used is =AVERAGE(B4:B6), which calculates the average revenue from January to March. Use Ctrl + D to copy the formula down through December.
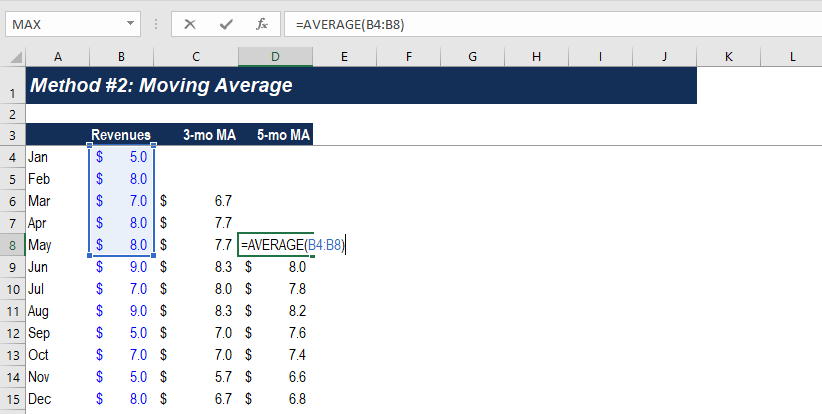
3. Similarly, the 5-month moving average forecasts revenue starting in the fifth period, which is May. In cell D8, we use the formula =AVERAGE(B4:B8) to calculate the average revenue for January to May. Copy the formula down using the shortcut Ctrl + D.
4. It is always a good idea to create a line chart to show the difference between actual and MA forecasted values in revenue forecasting methods. Notice that the 3-month MA varies to a greater degree, with a significant increase or decrease in historic revenues compared to the 5-month MA. When deciding the time period for a moving average technique, an analyst should consider whether the forecasts should be more reflective of reality or if they should smooth out recent fluctuations.
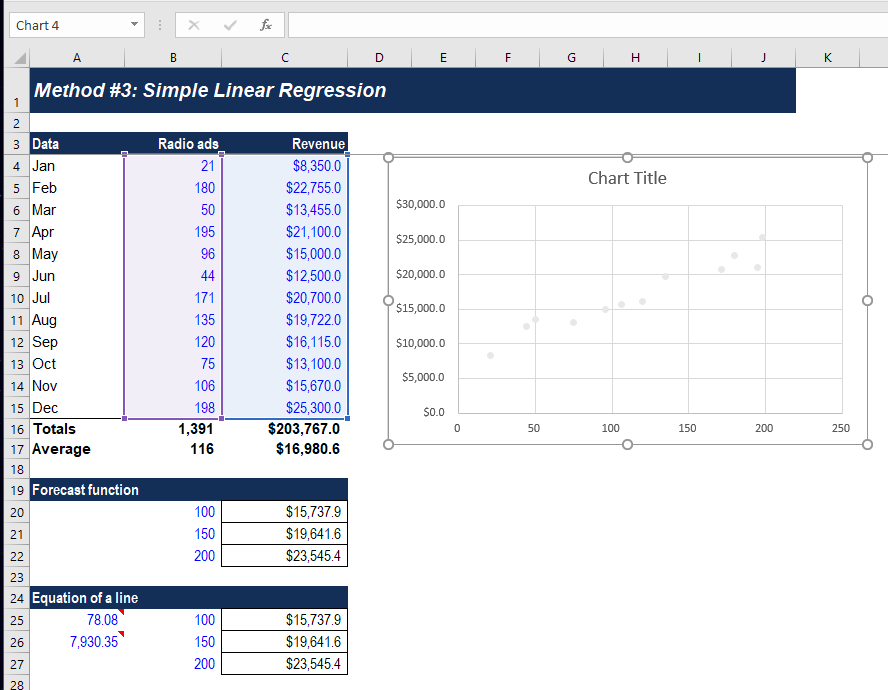
Regression analysis is a widely used tool for analyzing the relationship between variables for prediction purposes. In this example, we will look at the relationship between radio ads and revenue by running a regression analysis on the two variables.
1. Select the Radio ads and Revenue data in cells B4 to C15, then go to Insert > Chart > Scatter.
2. Right-click on the data points and select Format Data Series. Under Marker Options, change the color to desired and choose no borderline.
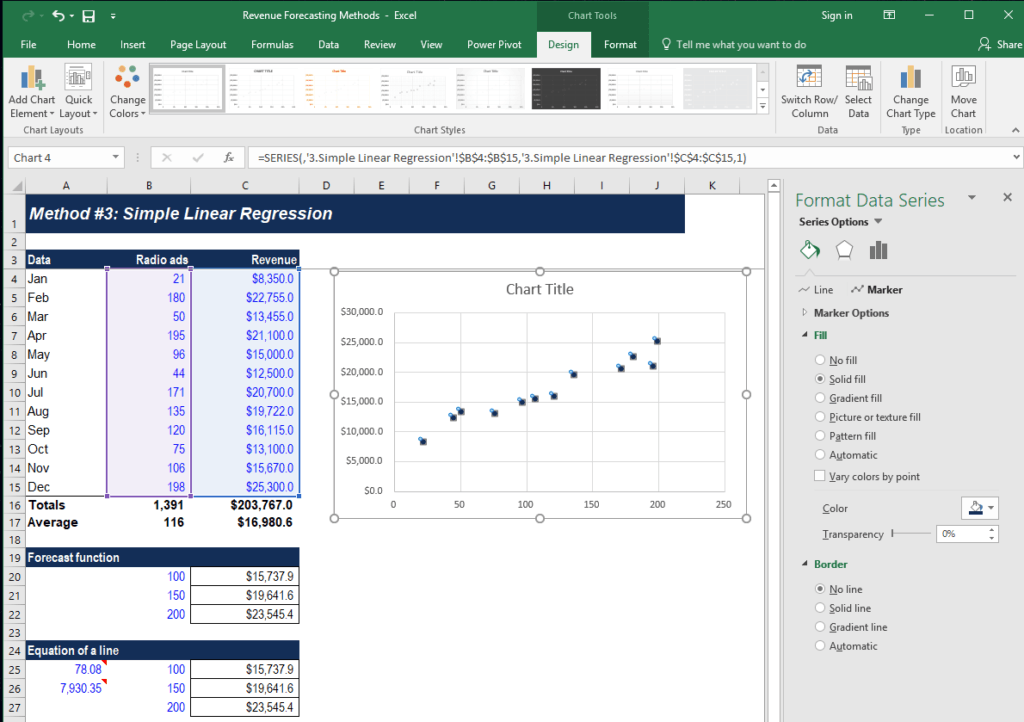
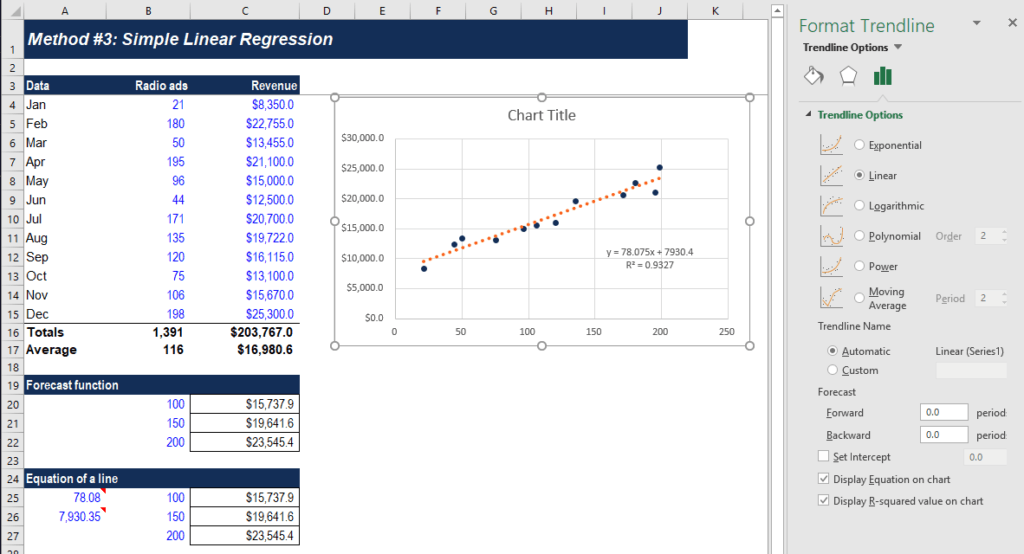
3. Right-click on data points and select Add Trendline. Choose Linear line and check the boxes for Display Equation on the chart and Display R-squared value on the chart. Move the equation box to below the line. Increase line width to 3 pt to make it more visible.
4. Choose no fill and no borderline for both chart area and plot area. Remove vertical and horizontal grid lines in the chart.
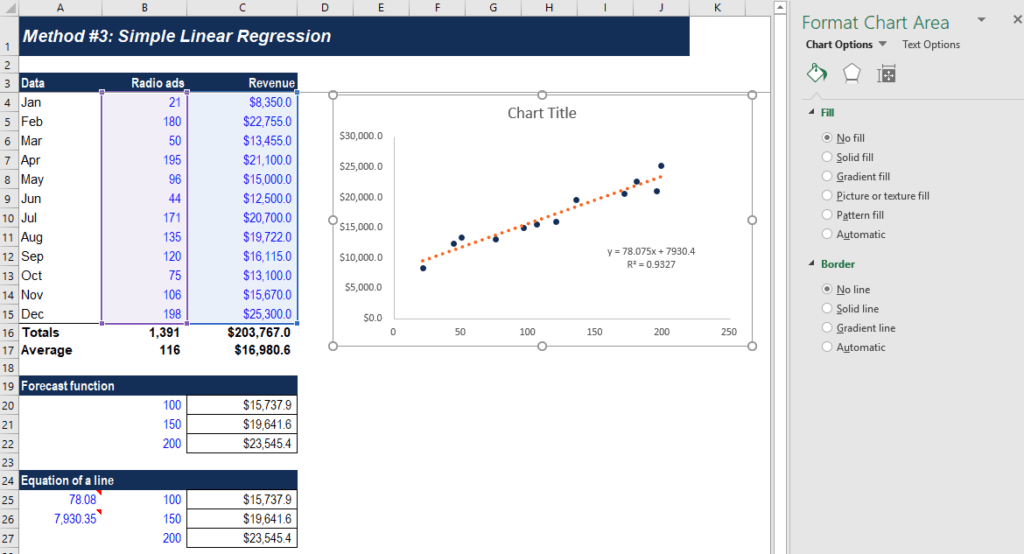
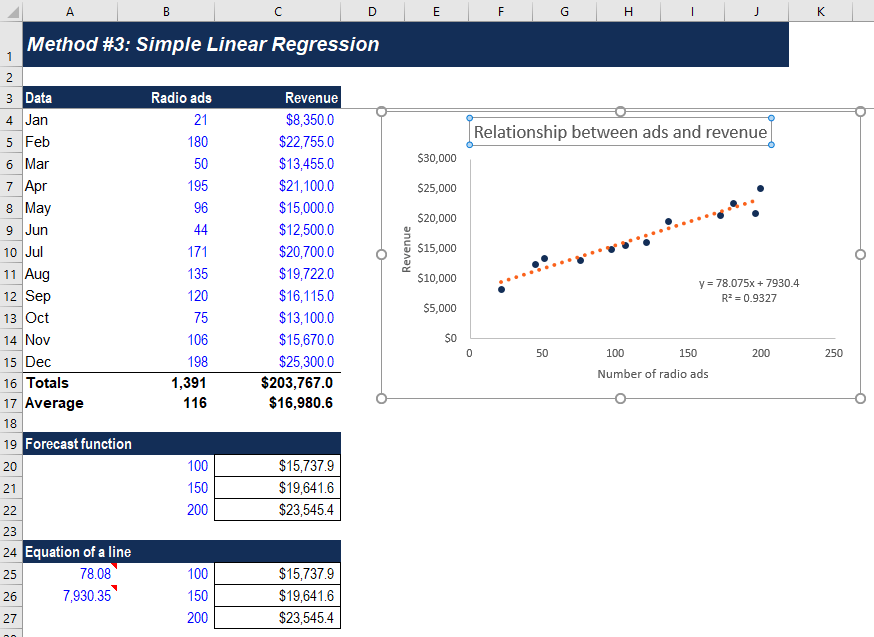
5. In the Design ribbon, go to Add Chart Element and insert both horizontal and vertical axis titles. Rename the vertical axis to “Revenue” and the horizontal axis to “Number of radio ads.” Change chart title to “Relationship between ads and revenue.”
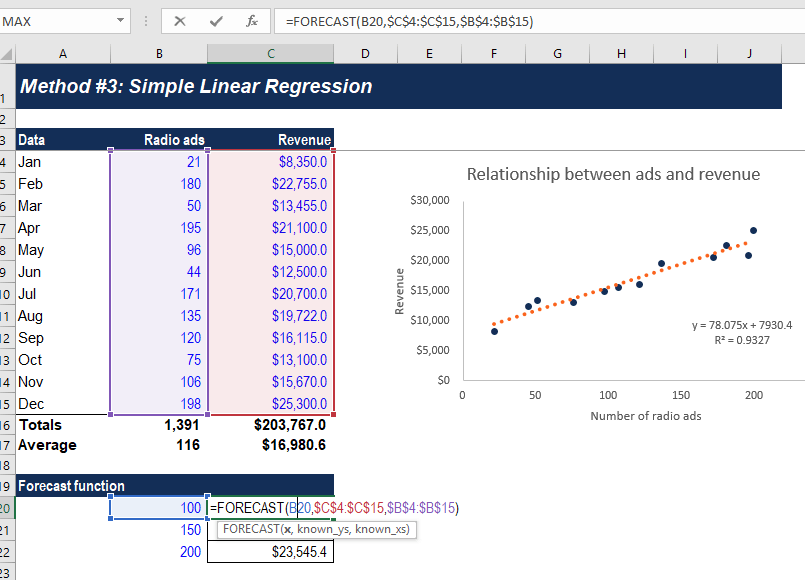
6. Besides creating a linear regression line, you can also forecast the revenue using the FORECAST function in Excel. For example, the company releases 100 ads in the next month and wants to forecast its revenue based on regression. In cell C20, use the formula = FORECAST(B20,$C$4:$C$15,$B$4:$B$15). The formula takes data from the Radio ads and Revenue columns to generate a forecast.
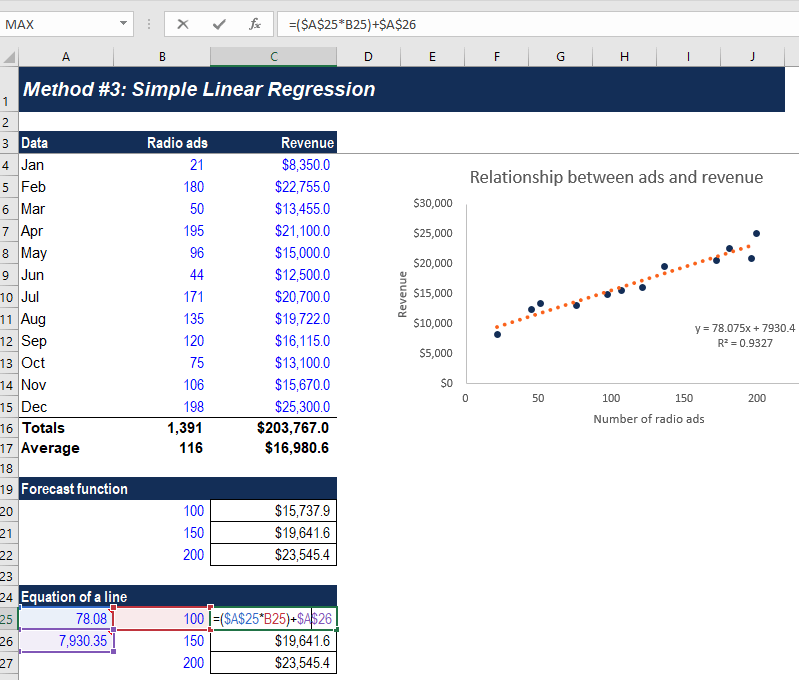
7. Another method is to use the equation of the regression line. The slope of the line is 78.08 and the y-intercept is 7930.35. We can use these two numbers to calculate forecasted revenue based on a certain x value. In cell C25, we can use the formula =($A$25*B25)+$A$26 to find out revenue if there are 100 radio ads.
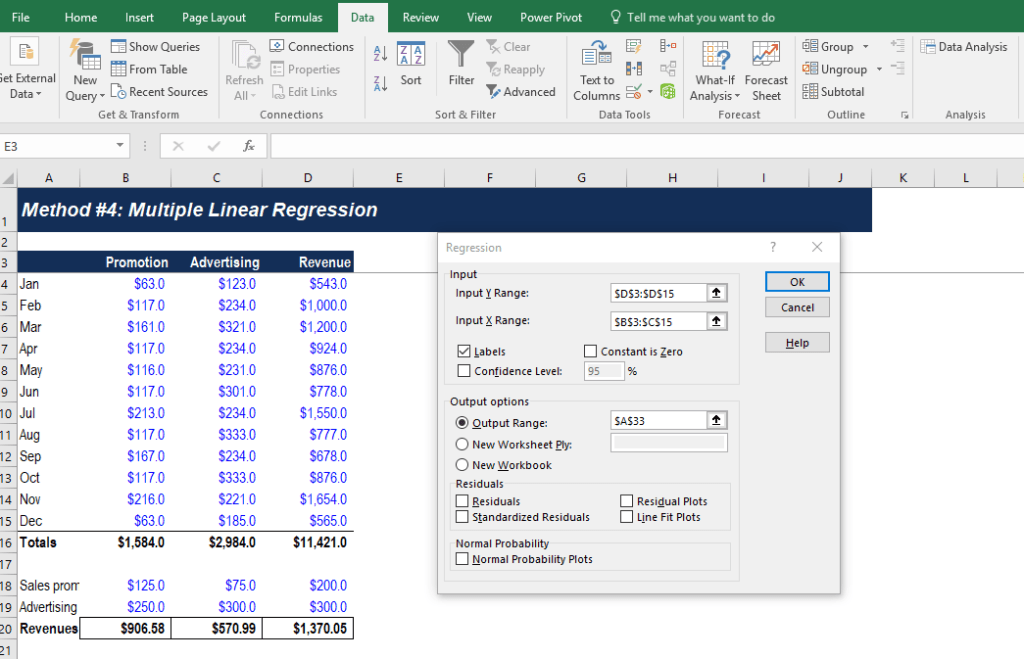
A company uses multiple linear regression to forecast revenues when two or more independent variables are required for a projection. In the example below, we run a regression on promotion cost, advertising cost, and revenue to identify the relationships between these variables.
1. Go to Data tab > Data Analysis > Regression. Select D3 to D15 for Input Y Range and B3 to C15 for Input X Range. Check the box for Labels. Set Output Range at cell A33.
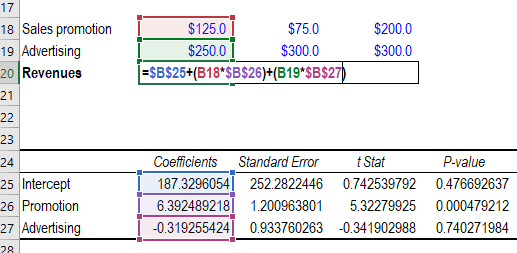
2. Copy the very last table from the summary output and paste it in cell A24. Using the coefficients from the table, we can forecast the revenue given the promotion cost and advertising cost. For example, if we expect the promotion cost to be 125 and the advertising cost to be 250, we can use the equation in cell B20 to forecast revenue: =$B$25+(B18*$B$26)+(B19*$B$27).
Each of the four methods has its advantages and disadvantages:
Advantages: This method is simple and straightforward to implement and understand. It’s also a suitable forecast method for stable businesses where the past trends are expected to continue.
Disadvantages: The straight-line method is overly simplistic by assuming a constant rate into the future, which is rarely the case in reality. It also assumes past results are indicative of future performance.
Advantages: The moving average method allows for smoothing out fluctuations in data, helping identify longer-term trends.
Disadvantages: The general trend of a variable can be different depending on the time period used in the analysis. Moving averages also don’t consider relationships between variables.
Advantages: This regression method is based on a clear mathematical model based on the relationship between variables, which may be more predictive of future outcomes. Additionally, confidence intervals and p-values can be calculated from the data, providing a statistical basis for forecasts.
Disadvantages: Linear regression assumes a linear relationship between variables, which might not be true in more complex systems where variables interact in non-linear ways.
Advantages: Multiple linear regression uses multiple independent variables, providing a more comprehensive view of factors that influence the dependent variable. This could lead to more accurate forecasts, assuming the model is specified correctly.
Disadvantages: This regression method requires a deeper understanding of statistics to implement and interpret. Multiple linear regression also requires more data and is computationally intensive, which can be a problem if resources and data collection are limited.
There are many factors to consider when choosing the right forecasting method. Below are some major considerations when deciding on a forecast methodology.
Does the data demonstrate seasonality, cyclicality, or a linear relationship with other variables? For example, forecasting using moving averages may be suitable if the data demonstrates a general but noisy trend. Regression methods are better when causal relationships exist.
High-level strategic forecasts are longer-term in nature and require an understanding of relationships between key variables, making them ideal for regression analysis. On the other hand, shorter-term forecasts for monthly or quarterly planning generally use less computationally intensive forecasting methods, so the straight-line method or moving averages are very common.
Industry-specific factors will also determine the best model to use. A highly volatile or high-growth industry is often unable to use the straight-line method or moving averages, since historical data won’t be applicable to projecting the future.
There’s always an inherent trade-off between model simplicity and accuracy. A simple model using straight-line forecasting is easier to implement and interpret but may not be very accurate. More complex models may offer greater accuracy but are more difficult to implement, understand, and explain.
The forecast team’s skills should also be considered. If the team does not currently have the skill set needed to handle more complex forecast models, simpler models are more appropriate.
Connect what you just learned to a clear career path with CFI’s role‑based courses and certification programs.
Thank you for reading this guide to the top revenue forecasting methods. To keep advancing your career, the additional CFI resources below will be useful:


