Get Certified for
Business Intelligence (BIDA®)
Develop analytical superpowers by learning how to use programming and data analytics tools such as VBA, Python, Tableau, Power BI, Power Query, and more.
A statistical technique that is used to predict the outcome of a variable based on the value of two or more variables
Multiple linear regression refers to a statistical technique that is used to predict the outcome of a variable based on the value of two or more variables. It is sometimes known simply as multiple regression, and it is an extension of linear regression. The variable that we want to predict is known as the dependent variable, while the variables we use to predict the value of the dependent variable are known as independent or explanatory variables.

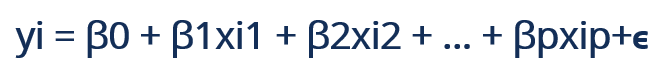
Where:
Simple linear regression enables statisticians to predict the value of one variable using the available information about another variable. Linear regression attempts to establish the relationship between the two variables along a straight line.
Multiple regression is a type of regression where the dependent variable shows a linear relationship with two or more independent variables. It can also be non-linear, where the dependent and independent variables do not follow a straight line.
Both linear and non-linear regression track a particular response using two or more variables graphically. However, non-linear regression is usually difficult to execute since it is created from assumptions derived from trial and error.
Multiple linear regression is based on the following assumptions:
The first assumption of multiple linear regression is that there is a linear relationship between the dependent variable and each of the independent variables. The best way to check the linear relationships is to create scatterplots and then visually inspect the scatterplots for linearity. If the relationship displayed in the scatterplot is not linear, then the analyst will need to run a non-linear regression or transform the data using statistical software, such as SPSS.
The data should not show multicollinearity, which occurs when the independent variables (explanatory variables) are highly correlated. When independent variables are multicollinear, it becomes difficult to determine which variable contributes to the variance in the dependent variable. The best method to test for the assumption is the Variance Inflation Factor method.
Multiple linear regression assumes that the amount of error in the residuals is similar at each point of the linear model. This scenario is known as homoscedasticity. When analyzing the data, the analyst should plot the standardized residuals against the predicted values to determine if the points are distributed fairly across all the values of independent variables. To test the assumption, the data can be plotted on a scatterplot or by using statistical software to produce a scatterplot that includes the entire model.
The model assumes that the observations should be independent of one another. Simply put, the model assumes that the values of residuals are independent. To test for this assumption, we use the Durbin-Watson statistic.
The test will show values from 0 to 4, where a value of 0 to 2 shows positive autocorrelation, and values from 2 to 4 show negative autocorrelation. The mid-point, i.e., a value of 2, shows that there is no autocorrelation.
Multivariate normality occurs when residuals are normally distributed. To test this assumption, look at how the values of residuals are distributed. It can also be tested using two main methods, i.e., a histogram with a superimposed normal curve or the Normal Probability Plot method.
Connect what you just learned to a clear career path with CFI’s role‑based courses and certification programs.
Thank you for reading CFI’s guide to Multiple Linear Regression. To keep learning and developing your knowledge base, please explore the additional relevant CFI resources below:


