Get Certified for
Capital Markets (CMSA®)
From equities and fixed income to derivatives, the CMSA certification bridges the gap from where you are now to where you want to be — a world-class capital markets analyst.
The golden industry standard for risk-adjusted return
Named after American economist, William Sharpe, the Sharpe Ratio (or Sharpe Index or Modified Sharpe Ratio) is commonly used to gauge the performance of an investment by adjusting for its risk.
The higher the ratio, the greater the investment return relative to the amount of risk taken, and thus, the better the investment. The ratio can be used to evaluate a single stock or investment, or an entire portfolio.
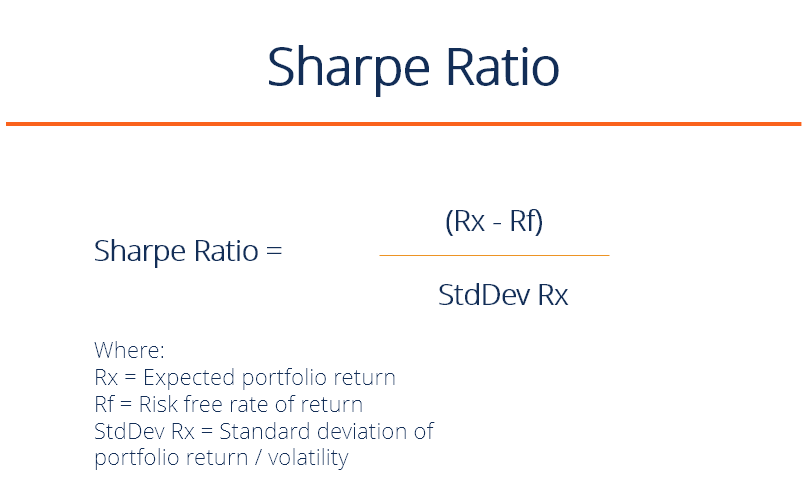
Sharpe Ratio = (Rx – Rf) / StdDev Rx
Where:
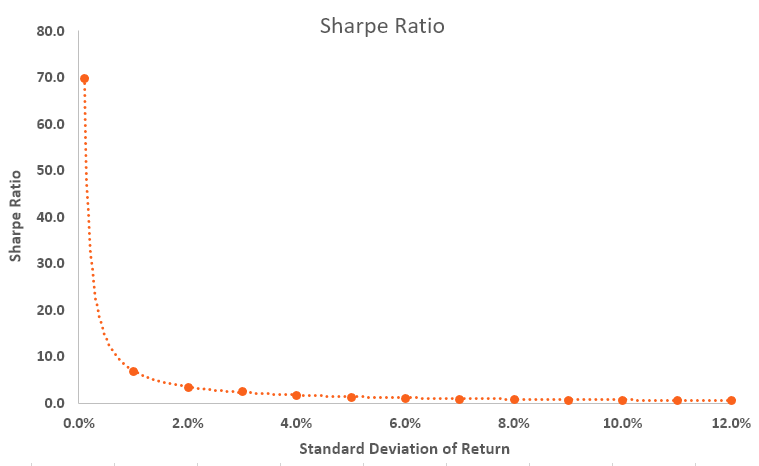
It’s all about maximizing returns and reducing volatility. If an investment had an annual return of only 10% but had zero volatility, it would have an infinite (or undefined) Sharpe Ratio.
Of course, it’s impossible to have zero volatility, even with a government bond (prices go up and down). As volatility increases, the expected return has to go up significantly to compensate for that additional risk.
The Sharpe ratio reveals the average investment return, minus the risk-free rate of return, divided by the standard deviation of returns for the investment. Below is a summary of the exponential relationship between the volatility of returns and the Sharpe Ratio.
Download the free Excel template now to advance your finance knowledge!
An investment portfolio can consist of shares, bonds, ETFs, deposits, precious metals, or other securities. Each security has its own underlying risk-return level that influences the ratio.
For example, assume that a hedge fund manager has a portfolio of stocks with a ratio of 1.70. The fund manager decides to add some commodities to diversify and modify the composition to 80/20, stocks/commodities, which pushes the Sharpe ratio up to 1.90.
While the portfolio adjustment might increase the overall level of risk, it pushes the ratio up, thus indicating a more favorable risk/reward situation. If the portfolio change causes the ratio to go down, then the portfolio addition, while potentially offering attractive returns, would be evaluated by many financial analysts as carrying an unacceptable level of risk, and the portfolio change would not be made.
Consider two fund managers, A and B. Manager A has a portfolio return of 20% while B has a return of 30%. S&P 500 performance is 10%. Although it looks like B performs better in terms of return, when we look at the Sharpe Ratio, it turns out that A has a ratio of 2 while B’s ratio is only 0.5.
The numbers mean that B is taking on substantially more risk than A, which may explain his higher returns, but which also means he has a higher chance of eventually sustaining losses.
Geometric Sharpe Ratio is the geometric mean of compounded excess returns divided by the standard deviation of those compounded returns.
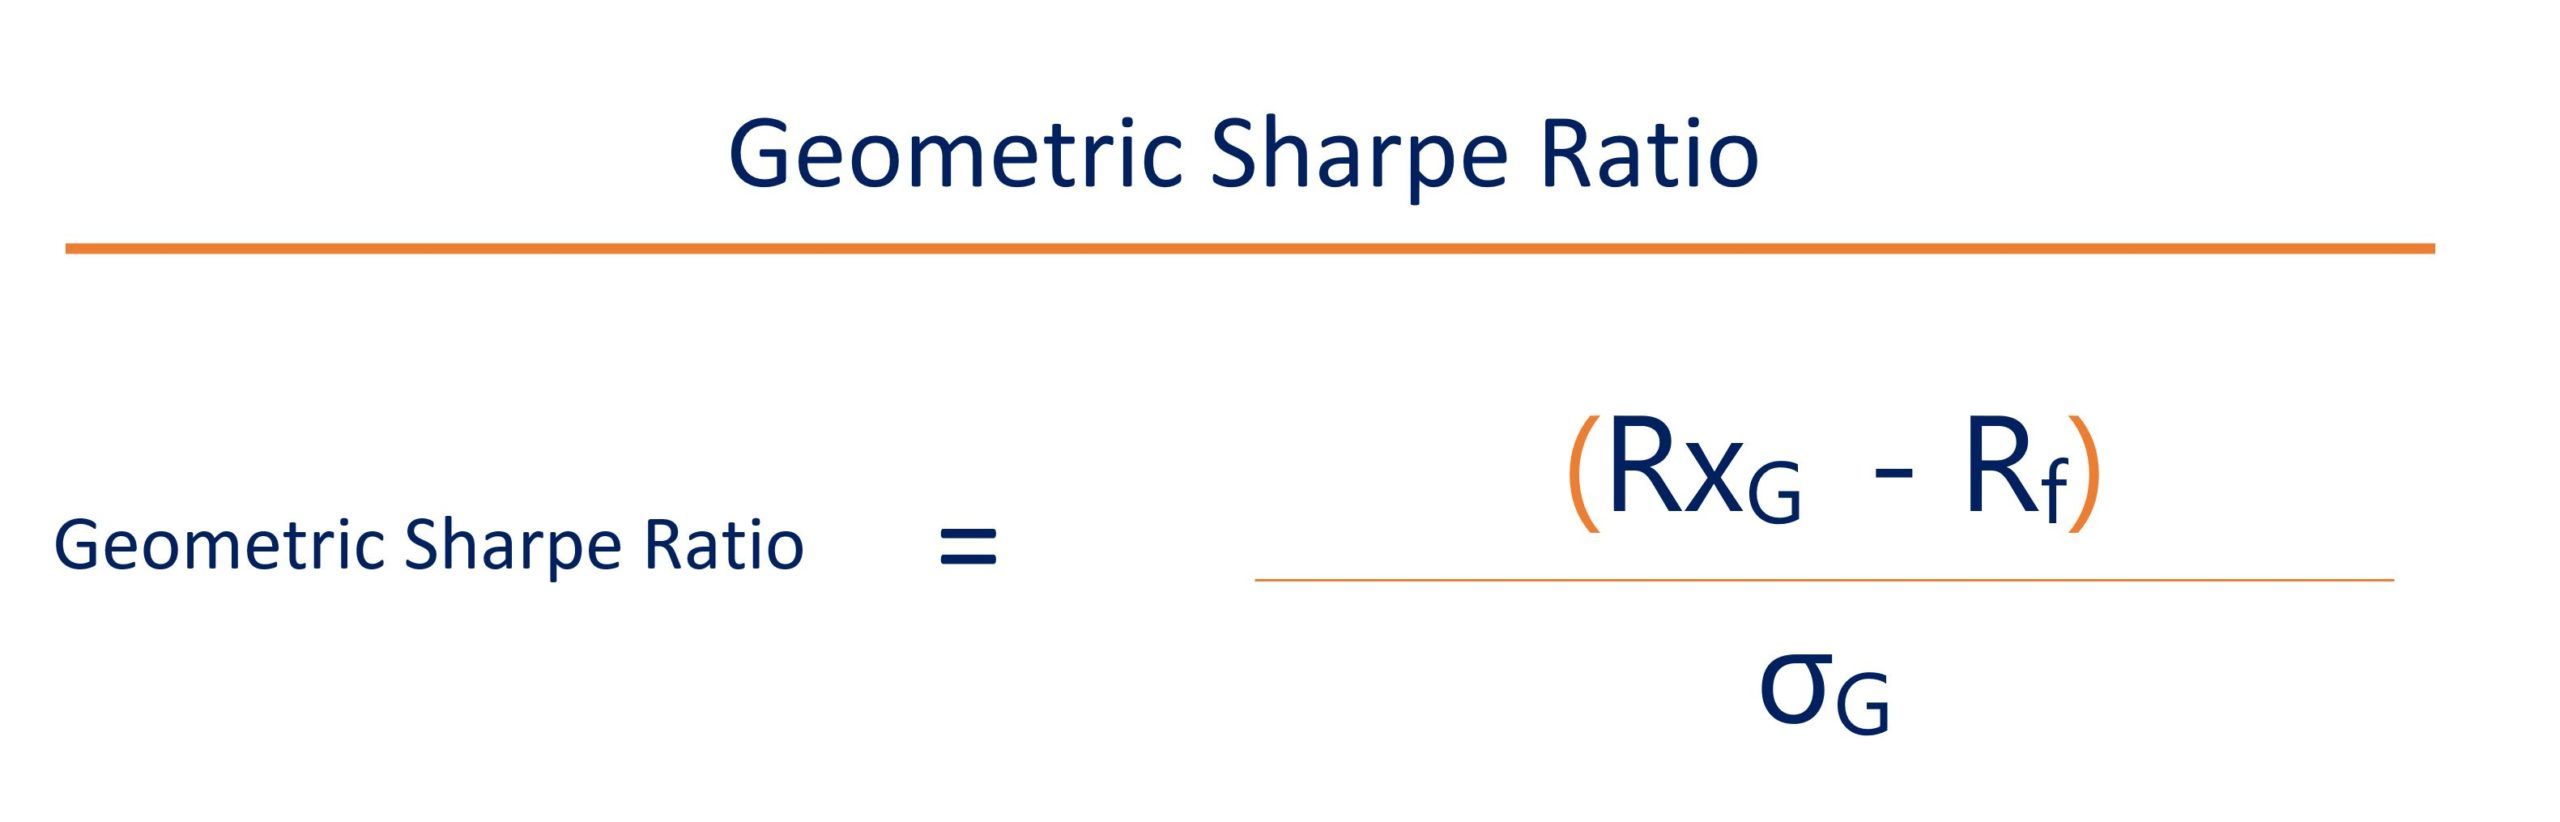
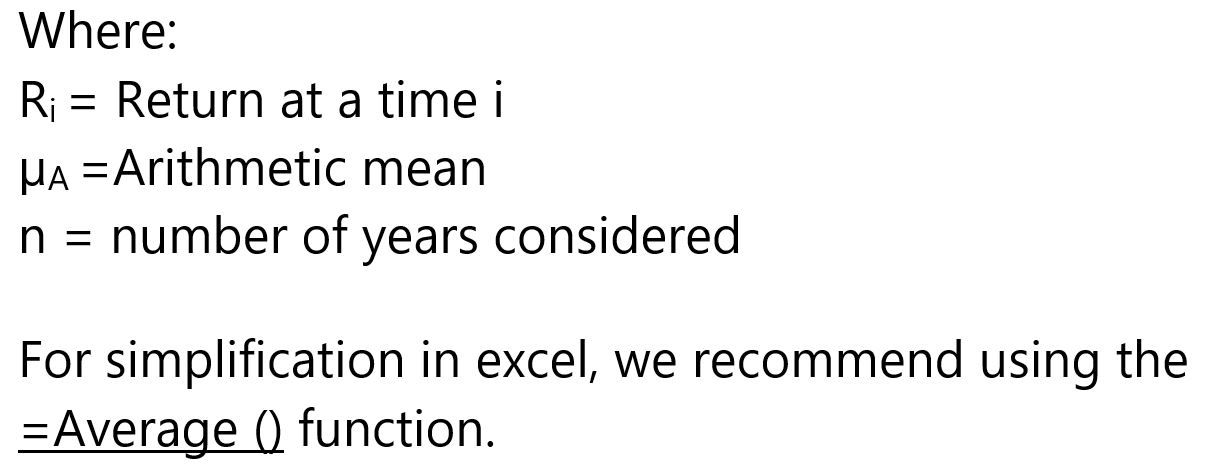
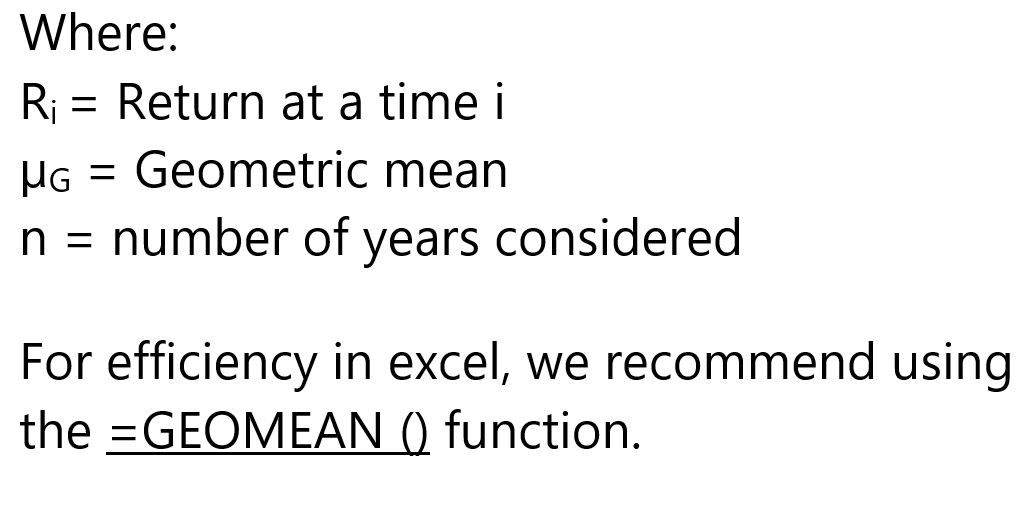
Where:
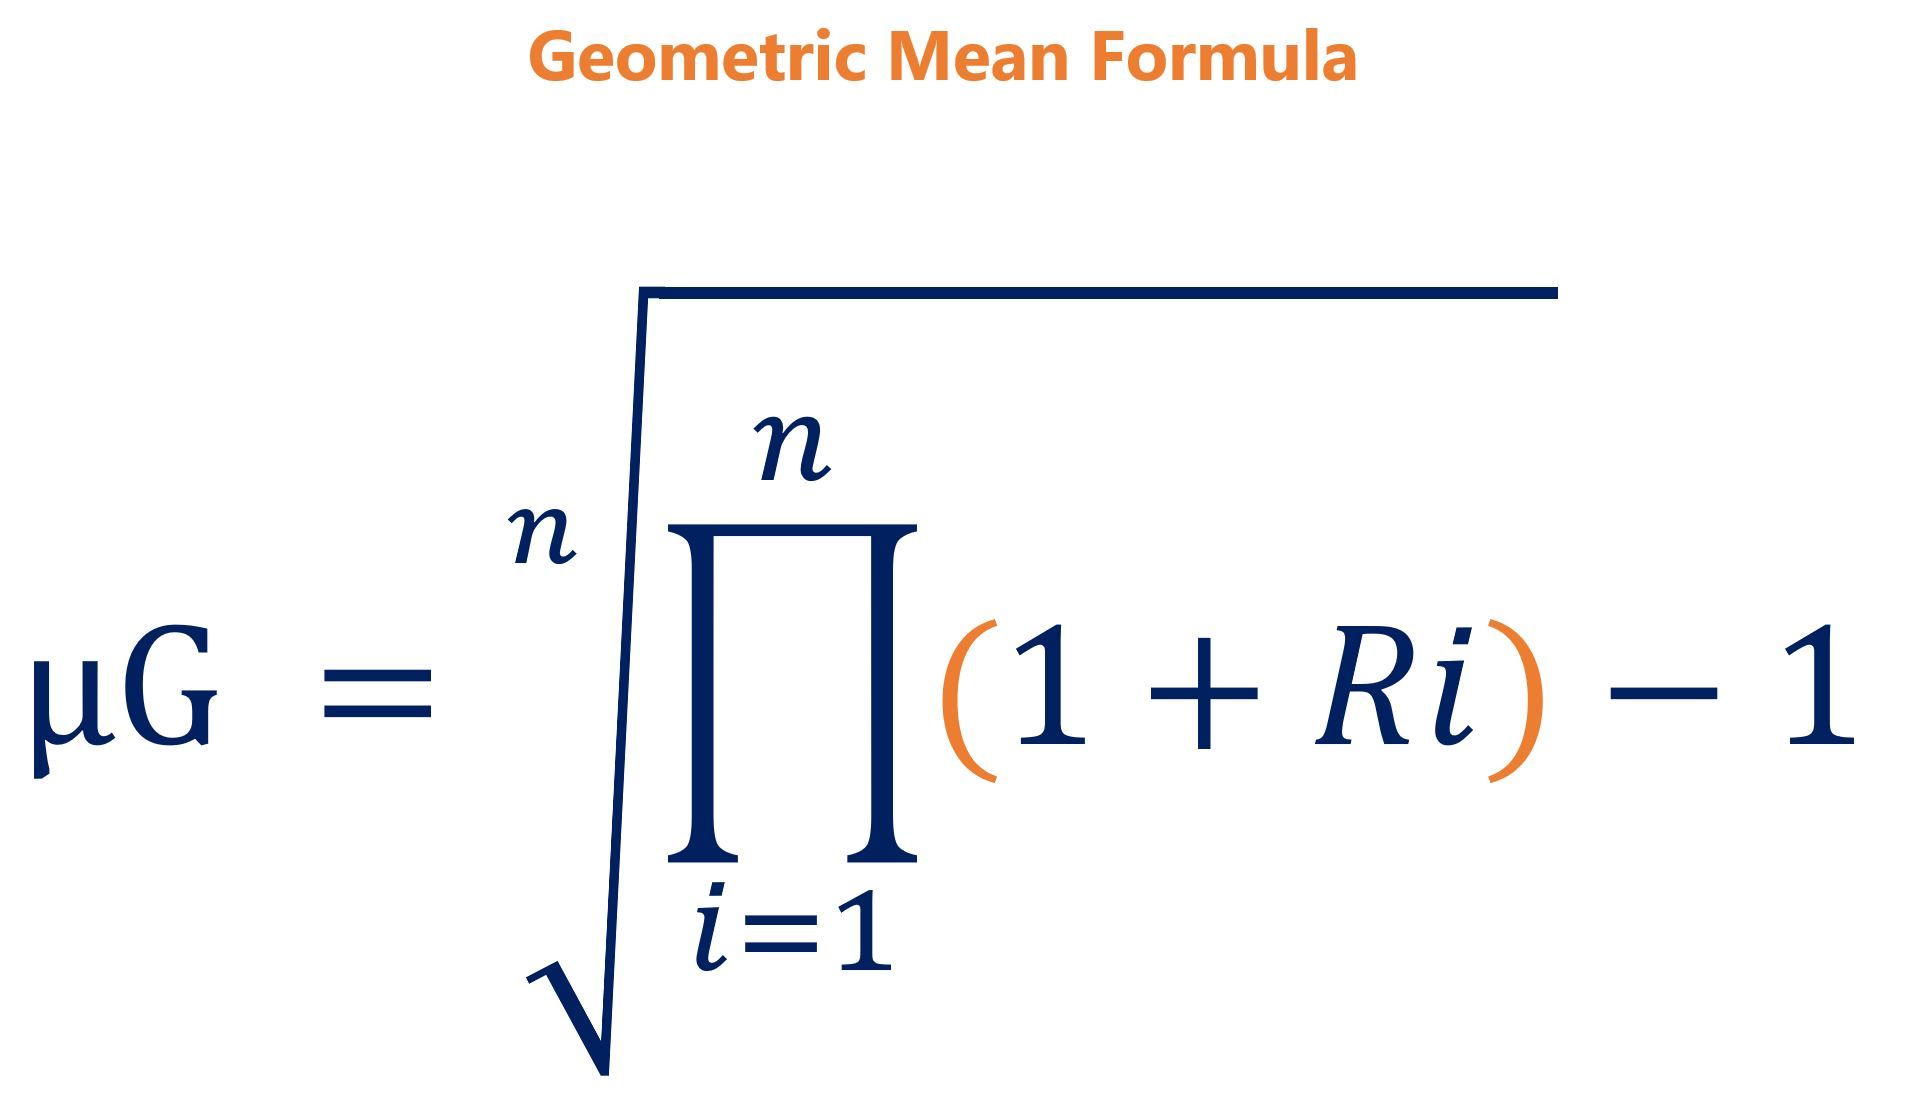
Since the Sharpe index already factors risk in the denominator, using geometric mean would double count risk. With volatility, the geometric mean will always be lower than its arithmetic mean.
On top of that, the Geometric Sharpe Ratio takes actual returns into account and is a more conservative ratio. Therefore, the main difference between the Modified Sharpe Ratio and Geometric Sharpe Ratio would be the average of the excess returns calculated using the formulas below:

Note: For an apple to apple comparison of returns, the Geometric Sharpe Ratio of a portfolio should always be compared with the Geometric Sharpe Ratio of other portfolios.
Thank you for reading CFI’s guide on Sharpe Ratio. To continue learning and advancing your career, we recommend these additional CFI resources:


