What Excel Skills Are Employers Looking For? Here Are the Top 10

What Excel Skills Are Most in Demand?

Employers look for Excel skills that demonstrate efficiency, analytical capability, and clear communication. The most valued skills include building professional workbooks, using keyboard shortcuts, applying statistical functions, creating PivotTables, and visualizing data through charts and dashboards. 

1. Building Professional Workbooks

Employers value professional workbooks because they’re auditable, shareable, and maintainable across teams. A professional workbook uses consistent formatting, clear labels, and standardized conventions that make financial models easy to follow and update.

Finance employers expect workbooks that remain accurate and easy to audit, even when multiple people contribute to them over time.

2. Working Efficiently with Excel Keyboard Shortcuts

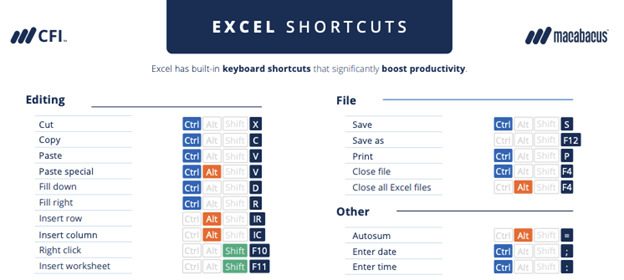
Using Excel keyboard shortcuts lets you work in Excel faster than with mouse clicks, reducing time spent on repetitive tasks. Employers recognize that keyboard proficiency directly correlates with productivity in finance roles where speed matters.

Mastering keyboard shortcuts demonstrates technical fluency and helps finance professionals complete analysis faster, meeting tight reporting deadlines common in business environments.

Excel Skills Employers Look For - Excel Shortcuts

Get a head start on learning Excel keyboard shortcuts—download CFI’s free guide to Excel shortcuts today.

3. Applying Basic Excel Functions for Statistical Analysis

Basic Excel functions form the foundation of statistical analysis in business and finance. Employers require strong function knowledge because financial reporting, forecasting, and analysis depend on accurate calculations and data manipulation.

For example, SUMIFS/COUNTIFS are the workhorses of finance analysis. Analysts use them constantly to aggregate data by multiple criteria. Or LOOKUP functions that allow professionals to combine data from different sources.

Employers consider these capabilities essential for entry-level and mid-level finance positions.

Excel Skills Employers Look For - LOOKUP Functions
Source: CFI’s Excel Fundamentals – Formulas for Finance course

4. Formatting Excel Worksheets for Readability and Professional Presentation

Worksheet formatting controls visual presentation to make data credible and easy to follow. Employers value formatting skills because financial reports must communicate clearly to stakeholders who make decisions based on presented data.

Proper formatting demonstrates attention to detail and professionalism, which are qualities employers associate with reliable financial analysis.

5. Linking Excel Workbooks

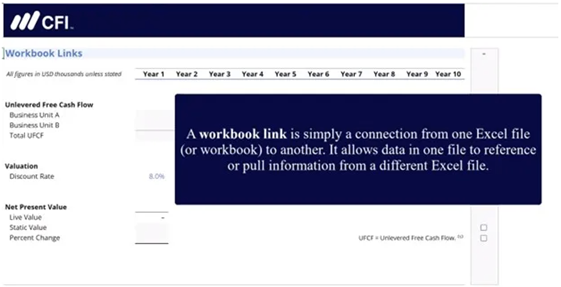
Excel workbook links connect data between multiple files, allowing updates in one workbook to flow automatically into linked workbooks. Employers value this skill for financial consolidation and reporting processes that require consistent data across multiple departments or reporting periods.

Linked workbooks reduce manual updates, maintain consistency across datasets, and ensure analyses reflect the most current financial data. These capabilities are critical for financial planning and analysis roles.

Excel Skills Employers Look For - Workbook Links
Source: CFI’s Excel for Data Preparation & Visualization course

6. Applying Dynamic Arrays

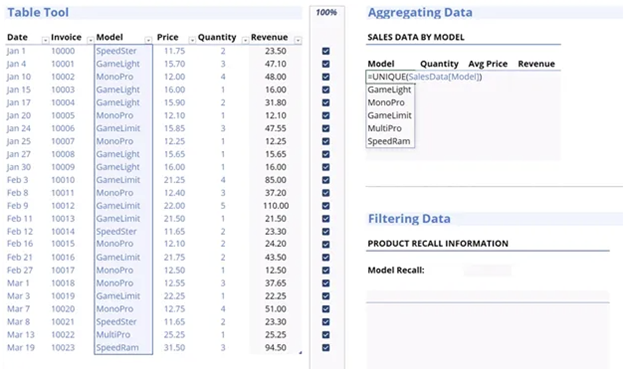
Dynamic Array functions allow a single formula to return multiple results automatically, transforming how Excel handles data calculations. Employers increasingly seek candidates familiar with Dynamic Arrays because these functions represent modern Excel best practices and significantly improve workbook efficiency.

Key Dynamic Arrays include FILTER, SORT, UNIQUE, and SEQUENCE, which simplify complex calculations and eliminate the need for manual ranges or copied formulas. Proficiency with Dynamic Arrays signals that candidates stay current with Excel’s evolving capabilities.

7. Transforming Data Using Advanced Excel Functions

Advanced Excel functions help you clean and transform raw data that contains formatting inconsistencies and errors. Employers prioritize data transformation skills because real-world financial data rarely arrives in analysis-ready format.

Key data transformation functions include:

  • TRIM() removes extra spaces in text, helping clean up the cells in the worksheet.
  • CLEAN() eliminates non-printable characters that can disrupt calculations or charts.
  • SUBSTITUTE() replaces unwanted symbols or text, such as removing dollar signs or units, so data can be standardized for analysis.
  • VALUE() converts numbers stored as text into actual numeric values.
  • IFERROR() handles invalid entries by returning a defined value like zero or blank.

By mastering data cleaning functions, you gain a productivity advantage. You’ll spend less time troubleshooting errors and more time uncovering insights.

Excel Skills Employers Look For - Table Text
Source: CFI’s Excel for Data Preparation & Visualization course

8. Summarizing and Analyzing Data with PivotTables

PivotTables summarize large datasets instantly by grouping, filtering, and calculating metrics without complex formulas. Proficiency with PivotTables is critical in analyst roles where you regularly analyze thousands of transactions or data points to identify trends and exceptions.

Strong PivotTable skills demonstrate analytical thinking and the ability to extract meaningful patterns from complex data.

9. Creating Visuals That Communicate Data Clearly

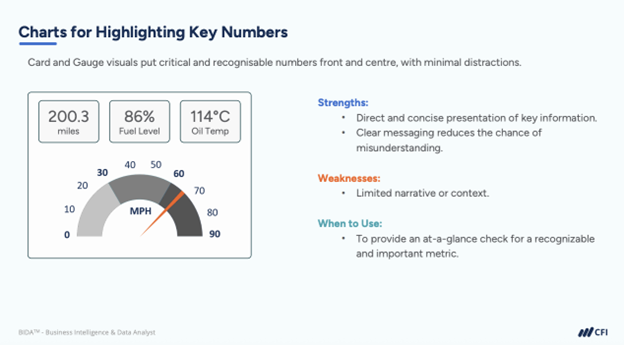
Data visualization transforms numbers into clear, compelling charts that highlight key insights for stakeholders. Employers value visualization skills because finance professionals must communicate findings to non-technical audiences, including executives who make strategic decisions based on presented analysis.

Strong visuals help audiences understand complex financial data quickly without reviewing raw numbers, making this skill crucial for roles involving stakeholder communication.

Excel Skills Employers Look For - Charts for Highlighting Key Numbers
Source: CFI’s Data Visualization and Dashboards – The Basics course

10. Combining Visuals Into Interactive Dashboards

Interactive dashboards combine charts, PivotTables, and slicers into one unified view that updates automatically. Employers seek dashboard skills because executive teams and department heads rely on real-time performance monitoring through consolidated reporting tools.

Dashboard proficiency distinguishes candidates for senior analyst and FP&A roles where presenting insights to leadership is a core responsibility.

Build Employer-Ready Excel Skills for Finance Careers

These 10 Excel skills directly align with what employers prioritize when hiring for business and finance positions. Proficiency in professional workbooks, statistical functions, PivotTables, and interactive dashboards demonstrates the technical fluency and communication skills that finance employers value most.

FAQs: Excel Skills Employers Look For

What Excel skills are most in demand?

Employers across business and finance prioritize building professional Excel workbooks, applying functions for business and finance analysis, and communicating data through visuals and dashboards. 

Do employers look for Excel skills?

Yes, Excel skills are essential requirements for many business and finance positions. Employers list Excel proficiency in job postings for finance, accounting, data analysis, operations, and administrative roles.

What do employers look for in an Excel test?

Employers use Excel tests to evaluate formula accuracy, problem-solving speed, and data presentation skills. Tests typically assess function knowledge (VLOOKUP, SUMIFS, IF statements), PivotTable creation, basic formatting, and the ability to clean messy data. 

Ready to strengthen your Excel skills? Explore CFI’s Excel Skills for Professionals Specialization today.

Additional Resources

Excel Test: 20 Questions to Assess Your Excel Skills

Excel Shortcuts for PC and Mac

Excel Formulas Cheat Sheet

See all Excel resources

0 search results for ‘