Documenting Excel Models Best Practices

Best practices for building financial models in Excel

Over 2 million + professionals use CFI to learn accounting, financial analysis, modeling and more. Unlock the essentials of corporate finance with our free resources and get an exclusive sneak peek at the first module of each course. Start Free

Documenting Excel Models Best Practices

When working on large and complicated financial models in Microsoft Excel, it can be quite challenging to document them clearly for ease of use and understandability. We will discuss several Excel model best practices and other useful tips and tricks that users can apply to maintain and audit their models more efficiently. Excel offers a variety of functions that enable users to better organize their workbooks and contents.

Key Highlights

  • Creating and working on large financial models in Excel can be quite challenging, so we’ve compiled a list of several tips and tools that can be used to make maintaining and auditing models more efficient.
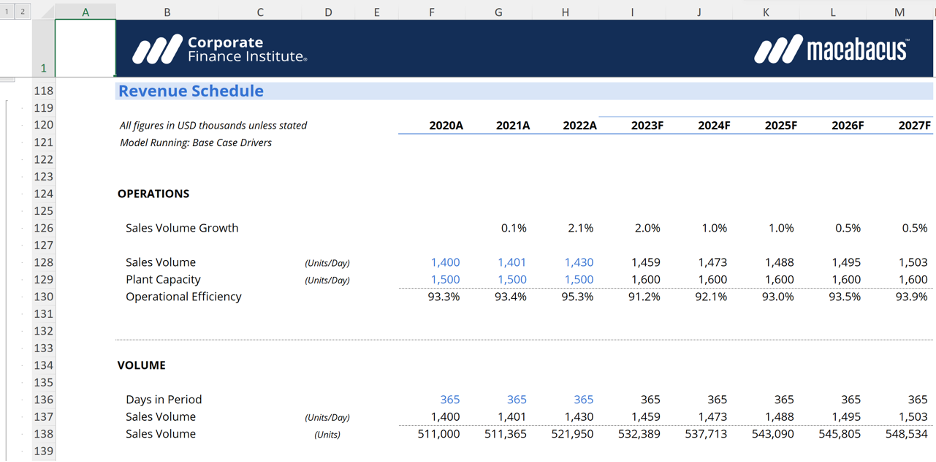
  • With the Grouping feature in Excel, all sections of a model can be collapsed (or expanded), giving the model a nice Table of Contents appearance.
  • Always title worksheets, charts, and tables for ease of use. Always clearly label data in your model so that a user can easily determine what metric is being used in a calculation or reference.

Model Structure

Financial modeling always involves the insertion of multiple inputs into the models in order to generate certain desired outputs. Most people tend to group all components on a single worksheet for simplicity. Sometimes it is more suitable to separate inputs, processes, and outputs into different worksheets or groupings as part of Excel models best practices.

The documentation method clearly defines the purpose of each worksheet/grouping so users can quickly navigate and find the information they need rather than searching through a long, single-page model.

Titles for Worksheets, Charts, and Tables

In Excel models’ best practices, it is always advisable to give titles to all worksheets, charts, and tables in your Excel models to clarify their purposes. The titles should be meaningful and precise, so users can grasp the main point at first glance.

Hyperlinks

We can use hyperlinks in a financial model to allow quick access to another section of the workbook or important information. Hyperlinks are commonly used in the table of contents to provide linkage to different worksheets/sections, but they can also be used to refer to context information or important formulas.

Labeling Values

When structuring the inputs section or any other parts of your financial models, you should make sure all the values are given labels because using unlabeled values in formulas and calculations can cause confusion and inefficiency in modeling. Sometimes, it is also useful to provide additional information about the cell values, such as units of measure, a brief description of the values, or other specific assumptions.

Cell Notes

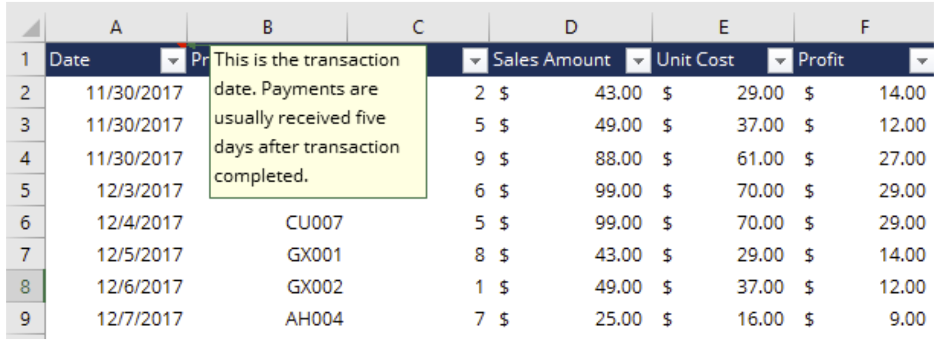
When you would like to include a detailed description of a cell value or an explanation for a calculation, you might insert a Note in the cell. This creates a small red triangle in the top right corner of the cell and displays a Note box when your mouse hovers over the cell.

Structured References

When you create an Excel Table, structured references are automatically applied in replacement of cell references when you enter a formula in another table column. Referring to the example below, instead of showing “=D2-E2” in cell F2, the column names (“Sales Amount” and “Unit Cost”) are used as structured references to calculate the profit.

You can also use structured references elsewhere in the Excel worksheet outside of a Table. The formula will show a combination of the table name (Ex. “ProductSale”) and column names (Ex. “Sales Amount”, “Unit Cost”). The references make it easier to locate tables in a large workbook and to understand what the values actually refer to.

Excel Models Best Practices - Tip #5

Data Validation

We can use Data Validation in financial models to add restrictions to the types of data that can be entered into a cell. Data Validation essentially provides information about the cell values and helps maintain standardized cell formats. One of the most common Data Validation uses is to create a drop-down list.

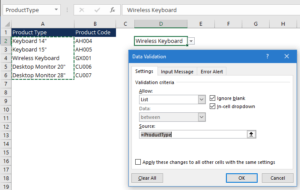
The most efficient way to create a drop-down list is to create your own list and give the list a name. In the example below, we make a list of products in cells A2:A6 and name it “ProductType.” When you use Data Validation to build a drop-down list, you can simply type the name defined for the list in the Source box, following an equal sign. Using a table allows you to add or remove items from the list, and the drop-down list will automatically update the content.

Excel Models Best Practices - Tip #6

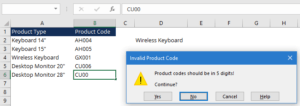
Besides drop-down lists, you can also add other types of data validation to restrict cell inputs to a whole number, decimal number within limits, date within a range of dates, text of a specified length, etc. In addition to input restrictions, you can add input messages or error alerts to point out invalid data.

Documenting Excel Models Best Practices - Tip #7

Conditional Formatting

Under the Home menu or ribbon, this tool allows you to set rules for certain cells that, when triggered, change the formatting of the cell. There are numerous types of formatting that can be used, but the most common is to use green or red to denote certain statuses of your cells.

For example, you may conditionally set the background of the net income cell of an income statement to color red when it’s in the negative and green otherwise. These visual cues enable the user to more quickly skim the model for the information they need.

Protection

Under the Review ribbon, Protection allows the user to define certain cells or worksheets that cannot be changed without the proper authorization. Normally, this means that the user will set a password that locks those cells or worksheets. When an unauthorized user tries to make changes to said cells or sheets, Excel will display an error message.

More Resources

Thank you for reading CFI’s guide to Excel Models Best Practices. CFI is the official global provider of the Financial Modeling & Valuation Analyst (FMVA)™ certification designed to transform anyone into a world-class financial analyst. To learn more, check out these relevant CFI resources:

Excel Tutorial

To master the art of Excel, check out CFI’s Excel Crash Course, which teaches you how to become an Excel power user.  Learn the most important formulas, functions, and shortcuts to become confident in your financial analysis.

Launch CFI’s Excel Course now

to take your career to the next level and move up the ladder!

0 search results for ‘