Get Specialized with our Financial Planning & Analysis (FP&A) Program
Support business leaders in their decision-making with best-in-class financial models to evaluate and forecast the financial performance of a company.
Comparative periods in FP&A (Financial Planning & Analysis) are specific timeframes used to measure and compare financial results from one time frame to another. These comparisons help you spot trends, understand business performance, and communicate results clearly to decision makers. Using comparative periods gives your analysis more context and meaning.
In this post, you’ll find clear definitions, uses, and examples for the most important comparative periods in FP&A.

A month-over-month (MoM) analysis compares the results for one month with those of the previous month. This approach highlights short-term changes in metrics like sales, expenses, or net income.
MoM analysis is most valuable when you need to monitor sudden shifts or volatility, such as tracking the immediate impact of a marketing campaign or sudden changes in operating expenses.
Example: Suppose your company’s operating expenses jumped from $100,000 in April to $120,000 in May. You calculate the MoM growth rate as follows:
MoM Change in Operating Expenses = ($120,000 – $100,000) ÷ $100,000 = 0.20 x 100% = 20%
Your calculation shows a 20% spike in expenses during May. MoM analysis provides an early warning, giving you the chance to address the root causes before higher costs continue into future months. For instance, you might review recent vendor invoices for unexpected charges, examine unplanned project costs, or check for overtime or staffing changes.
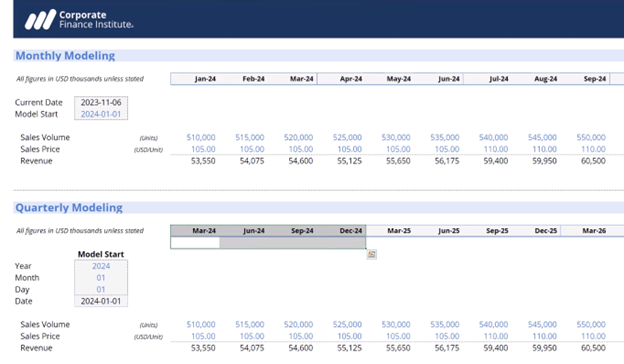
A quarter-over-quarter (QoQ) compares results for one quarter with those of the previous quarter. This approach makes it easy to track changes and performance over three-month periods, highlighting shifts that may be missed in month-to-month or annual comparisons.
CFOs, executive teams, and boards of directors use QoQ comparisons to review ongoing business results, monitor strategic initiatives, and support timely decision making.
Example: Imagine that your company’s sales revenue increased from $1.2 million in Q1 to $1.5 million in Q2. However, gross margin dropped from 35% in Q1 to 30% in Q2.
You calculate the quarter-over-quarter change rate for revenue and operating margin, which shows that revenue grew by 25% while gross margin decreased by 14.3% [(30% – 35%) ÷ 35%]. These results signal strong top-line growth. However, the company is earning less profit on each dollar of revenue, signaling the need for further investigation.
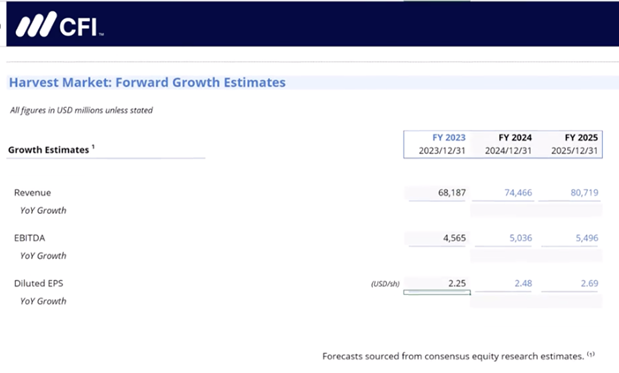
A year-over-year (YoY) analysis compares results for a specific period, such as a month or quarter, with the same period in the previous year. This approach is essential for measuring growth and understanding how seasonality or recurring cycles impact financial performance.
FP&A teams, CFOs, and company leadership all rely on YoY analysis to guide strategic planning, evaluate business initiatives, and set future performance targets. Investors and equity research analysts use YoY comparisons to assess a company’s long-term growth, profitability, and performance relative to peers.
Example: You’ve been assigned to run a YoY analysis of financial results for the second quarter of 2025. The company’s revenue for Q2 2024 was $2 million with a 20% operating margin. In Q2 2025, revenue grew to $2.5 million, and operating margin increased to 24%.
You calculate the year-over-year change rates for revenue and operating margin. According to your YoY analysis, revenue grew by 25% compared to the same quarter last year, showing significant top-line growth. At the same time, the operating margin improved by 20%, meaning the company is earning more profit on each dollar of sales.
This combination points to both increased sales and improved efficiency or cost management. Together, these YoY results signal strong business performance that may attract interest from investors or drive positive discussions at the board level.
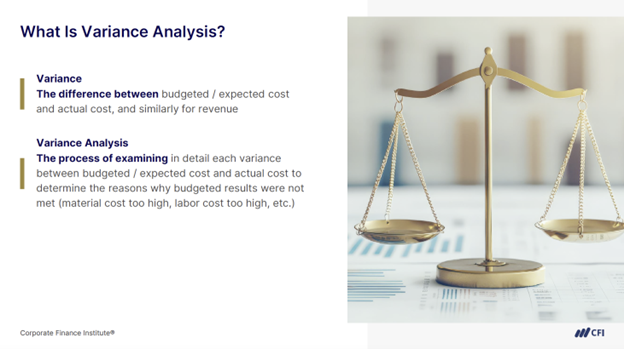
Budget vs. actual analysis, also called variance analysis, compares your planned financial targets, set in the budget, to what actually happened over a specific period. A variance is the difference between budgeted and actual figures.
This comparison is essential for monitoring performance, controlling costs, and holding teams accountable. It highlights areas where results diverge from forecasts and expectations, helping managers investigate the causes behind financial results.
Department managers, FP&A teams, and executives rely on budget vs. actual analysis to guide resource allocation and inform corrective actions.
Example: If budgeted expenses were $500,000 for the quarter but actual expenses were $550,000, the variance is $50,000 over budget.
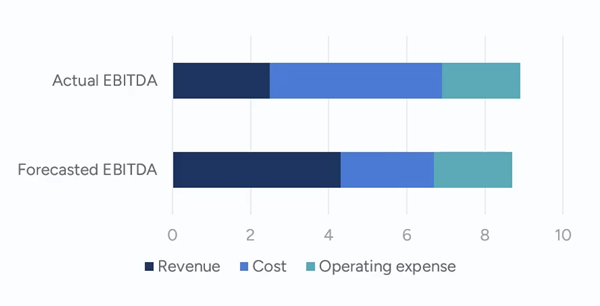
Forecast vs. actual analysis measures the difference between your most recent financial projections (forecasts) and the actual results achieved during the same period.
This analysis helps organizations assess the accuracy of their forecasts and adjust their planning processes. It’s particularly useful in dynamic environments, where updated forecasts guide agile decision making and resource management.
FP&A teams, CFOs, and operations leaders depend on forecast vs. actual comparisons to improve forecasting methods and support timely business decisions.
Example: If Q2 sales were forecast at $120,000 but actual sales reached $110,000, the forecast variance is $10,000 below expectations.
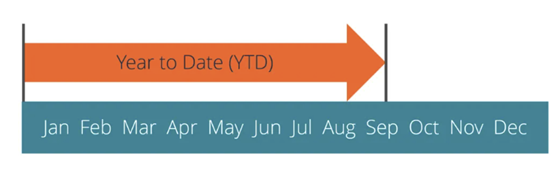
Year-to-date (YTD) is the period from the beginning of the current fiscal year up to the present date. YTD can apply to revenue, expenses, profit, or other key metrics.
YTD analysis gives you a running total, making it easier to see overall progress toward annual goals or targets. It helps FP&A professionals identify trends that may not be visible in monthly or quarterly results and is useful for benchmarking performance at any point in the year.
Board members, executive leadership, and cross-departmental managers frequently use YTD figures for regular updates and performance reviews.
Example: If total sales from January through August amount to $900,000, that’s the YTD sales figure as of the end of August.
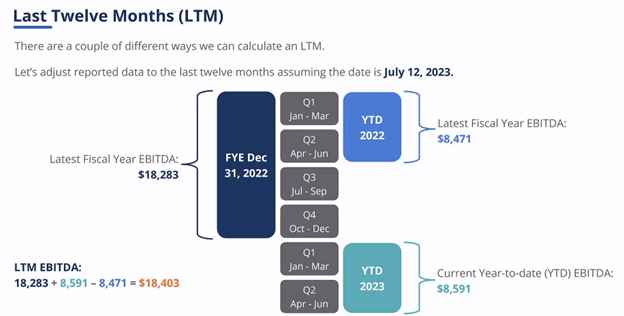
The last twelve months (LTM) period, also called trailing twelve months (TTM), refers to the most recent 12-month period, regardless of when a fiscal or calendar year begins. For example, as of June 1st, the LTM period would be the preceding twelve months, i.e., June (of the prior year) through May (of the current year).
LTM analysis is valuable for FP&A teams, CFOs, and business leaders for assessing trends, profitability, and growth without the distortion of one-off events or seasonal fluctuations.
Example: Your organization generated $5 million in revenue from September 2024 through August 2025. This revenue figure represents the LTM revenue as of August 2025.
A rolling forecast predicts a company’s future financial results over a continuous period instead of a fixed period like a quarter or fiscal year. Rolling forecasts typically cover the upcoming 12 months, enabling FP&A teams to adjust quickly to market changes, emerging trends, or unexpected events.
Example:
Suppose you maintain the rolling forecast for the FP&A team. At the end of each month, a new month is added to the forecast, keeping projections 12 months into the future. The image below illustrates this concept:
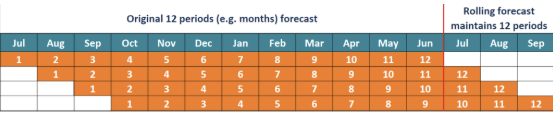
As July, August, and September ended in the original 12-month forecast, each future month was added to the forecast to maintain the forward-looking period.
Understanding comparative periods is essential for effective forecasting, performance analysis, and strategic planning in FP&A. These timeframes add context to financial results and help leaders understand trends to support their decision-making.
Comparative periods are also fundamental to building financial models for forecasting, performance monitoring, and analysis. For FP&A professionals, adding financial modeling capabilities to your skillset is a powerful way to make a bigger impact on your organization and career.
Ready to build world-class financial modeling skills? CFI’s FP&A Specialization equips you with the skills and knowledge to excel as an FP&A professional. Emerge from this program prepared to support business leaders with top-tier financial models, budgets, forecasts, analysis, and more. Learn the techniques used by top finance teams at Amazon, JPMorgan, and PwC.


