Get Certified for Financial Modeling (FMVA)®
Gain in-demand industry knowledge and hands-on practice that will help you stand out from the competition and become a world-class financial analyst.
A class of ratios that measure the indebtedness of a firm
A leverage ratio is any kind of financial ratio that indicates the level of debt incurred by a business entity against several other accounts in its balance sheet, income statement, or cash flow statement.
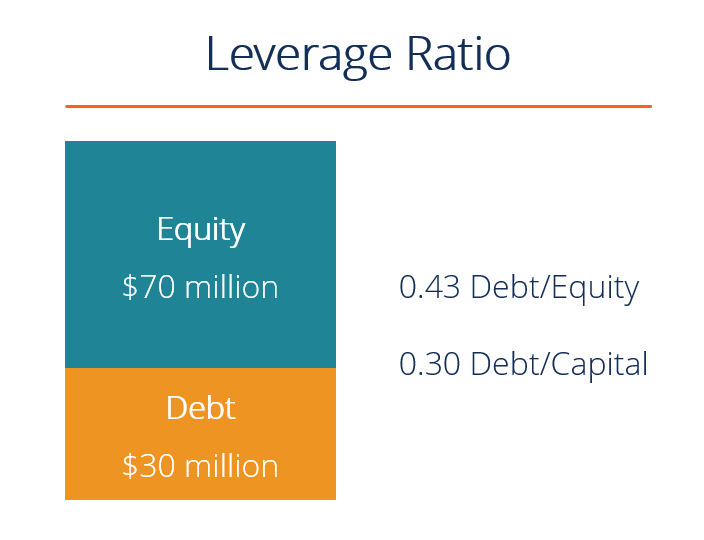
The leverage ratios provide an indication of how the company’s assets and business operations are financed (using debt or equity). Below is an illustration of two common leverage ratios: debt/equity and debt/capital.
In finance, leverage is a strategy that companies use to increase assets, cash flows, and returns, though it can also magnify losses. To increase leverage, a firm may borrow capital through issuing fixed-income securities or by borrowing money directly from a lender.
Leverage is created through various situations:
There are several different leverage ratios that may be considered by market analysts, investors, or lenders. Some accounts that are considered to have significant comparability to debt are total assets, total equity, operating expenses, and income.
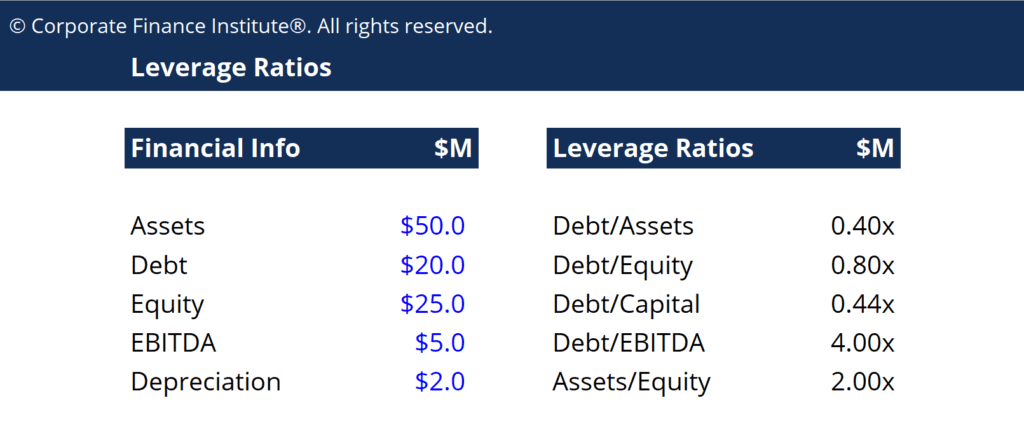
Below are 5 of the most commonly used leverage ratios:
Imagine a business with the following financial information:
Now, calculate each of the five ratios outlined above as follows:
If a business has total assets worth $100 million, total debt of $45 million, and total equity of $55 million, then the proportionate amount of borrowed money against total assets is 0.45, or less than half of its total resources. When comparing debt to equity, the ratio for this firm is 0.82, meaning equity makes up a majority of the firm’s assets.
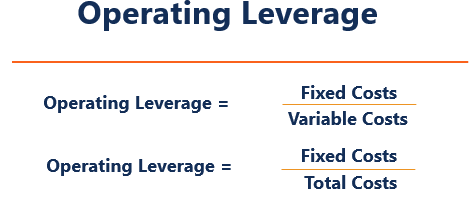
An operating leverage ratio refers to the percentage or ratio of fixed costs to variable costs. A company with high operating leverage bears a large proportion of fixed costs in its operations and is a capital-intensive firm. Small changes in sales volume can result in significant changes in earnings and return on investment.
A negative scenario for this type of company could occur when its high fixed costs are not covered by earnings due to a decrease in market demand for the product. An example of a capital-intensive business is an automobile manufacturing company.
If the ratio of fixed costs to revenue is high (i.e., >50%), the company has significant operating leverage. If the ratio of fixed costs to revenue is low (i.e., <20%), the company has little operating leverage.
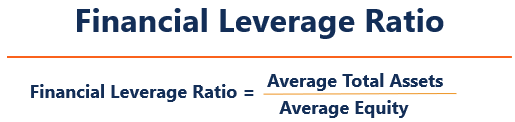
A financial leverage ratio refers to the amount of obligation or debt held by a company or will use to finance its business operations. Using borrowed funds, instead of equity funds, can really improve the company’s return on equity and earnings per share, provided that the increase in earnings is greater than the interest paid on the loans. Excessive use of financing can lead to default and bankruptcy.
The ratio is an indicator of how much debt a company is using to finance its assets. A high ratio means the firm is highly levered (using a large amount of debt to finance its assets). A low ratio indicates the opposite.
A combined leverage ratio refers to the combination of using both types of leverage mentioned above. For example, when viewing the balance sheet and income statement, operating leverage influences the upper half of the income statement through operating income, while the lower half consists of financial leverage, wherein earnings per share to the stockholders can be assessed.
Leverage ratios represent the extent to which a business is utilizing borrowed money. It also evaluates company solvency and capital structure. Having high leverage in a firm’s capital structure can be risky, but it also provides benefits.
The use of leverage is beneficial during times when the firm is earning profits, as they become amplified. On the other hand, a highly levered firm will have trouble if it experiences a decline in profitability and may be at a higher risk of default than an unlevered or less levered firm in the same situation.
Finally, analyzing the existing level of debt is a crucial factor that creditors consider when a firm seeks to apply for additional borrowing.
Essentially, leverage adds risk, but it also creates a reward if things go well.
Besides the ratios mentioned above, we can also use the coverage ratios in conjunction with the leverage ratios to measure a company’s ability to pay its financial obligations.
The most common coverage ratios are:
Leverage ratios measure the degree to which a company uses debt to finance its assets and operations. They provide insights into solvency, capital structure, and financial risk by comparing debt against equity, assets, or earnings. Common ratios include Debt-to-Assets, Debt-to-Equity, Debt-to-Capital, Debt-to-EBITDA, and Asset-to-Equity.
Leverage itself is the strategic use of borrowed funds to amplify returns, though it can equally magnify losses. There are three main types: Operating Leverage (fixed vs. variable costs), Financial Leverage (use of debt financing). and Combined Leverage (interaction of both). While leverage boosts profits in good times, excessive reliance raises default risk.
Connect what you just learned to a clear career path with CFI’s role‑based courses and certification programs.
This leverage ratio guide has introduced the main ratios: Debt/Equity, Debt/Capital, Debt/EBITDA, etc. Below are additional relevant CFI resources to help you advance your career.


