Learn Data Visualization with CFI

What's Available

In a world dominated by data, it’s almost impossible to find an industry that isn’t data-driven. With the amount of data we collect, we need data visualization to properly analyze our changing metrics. Using real-world examples, we’ll guide you through the most widely used tools, including Power BI and Tableau. CFI's quizzes, data sets, and interactive exercises will allow you to learn by doing and practice your skills.

World-class courses

Consisting of over 1120 lessons

Interactive exercises

Learn by doing with guided simulations

Expert instructors

Learn from the very best

New courses monthly

On need-to-know subject matter

Blockchain certificate

To verify your skills

500,000+ 5-star ratings

Best-in-class training, as rated by you

Start Your Data Visualization Learning Path

Data visualization tools allow us to see and manipulate data in interactive dashboards, giving us the power to derive insights on the fly. While many popular tools are user-friendly, it takes time to master the skills that will set you apart. Our courses are designed for students and finance professionals looking to develop their skill sets and communicate data insights more effectively. We build on data science principles to teach real-world skills for data visualization. All courses are part of CFI’s Business Intelligence & Data Analyst (BIDA)® Program, which covers basic, intermediate, and advanced concepts.

Courses and Case Studies in Data Visualization

Browse all courses

Why Learn Data Visualization with CFI?

Designed with the guidance of professional Wall Street trainers who teach new hires at global investment firms, CFI offers finance-focused training and skill development. As a leader in online financial analyst certification programs, we use innovative design, proprietary technology, and top instructors to ensure optimal learning and retention.

All CFI courses are 100-percent online and condensed into self-paced programs. You can take courses anytime, from anywhere, to learn new skills and prepare for your future career.

Over 75% of CFI learners report improved productivity or competency within weeks.

With our data visualization courses, you will learn:

How to create visuals with clear messages
Why clean data is necessary to build exceptional visuals
Data normalization and how to manipulate data for better analysis
How to create interactive dashboard visuals that impress and inform
Features that make you stand out, like pop-ups, highlights, and LODs
Diverse visuals that convey different types of information

Who is data visualization training for?

Our data visualization courses are designed for aspiring and experienced professionals alike. Whatever the analysis you’re working on, at some point you’ll need to communicate your results, and that’s where you’ll need data visualization skills. Participants can use our data visualization courses towards their Business Intelligence & Data Analyst (BIDA)® certification, or simply to demonstrate proficiency for a new job or promotion.

Investment professionals

Management consultants

Financial analysts

Registered Provider: National Association of State Boards of Accountancy

All courses are accredited by the Better Business Bureau (BBB), CPA Institutions in Canada, and the National Association of State Boards of Accountancy (NASBA) in the US. Most courses qualify for verified CPE credits for CPA charter holders.

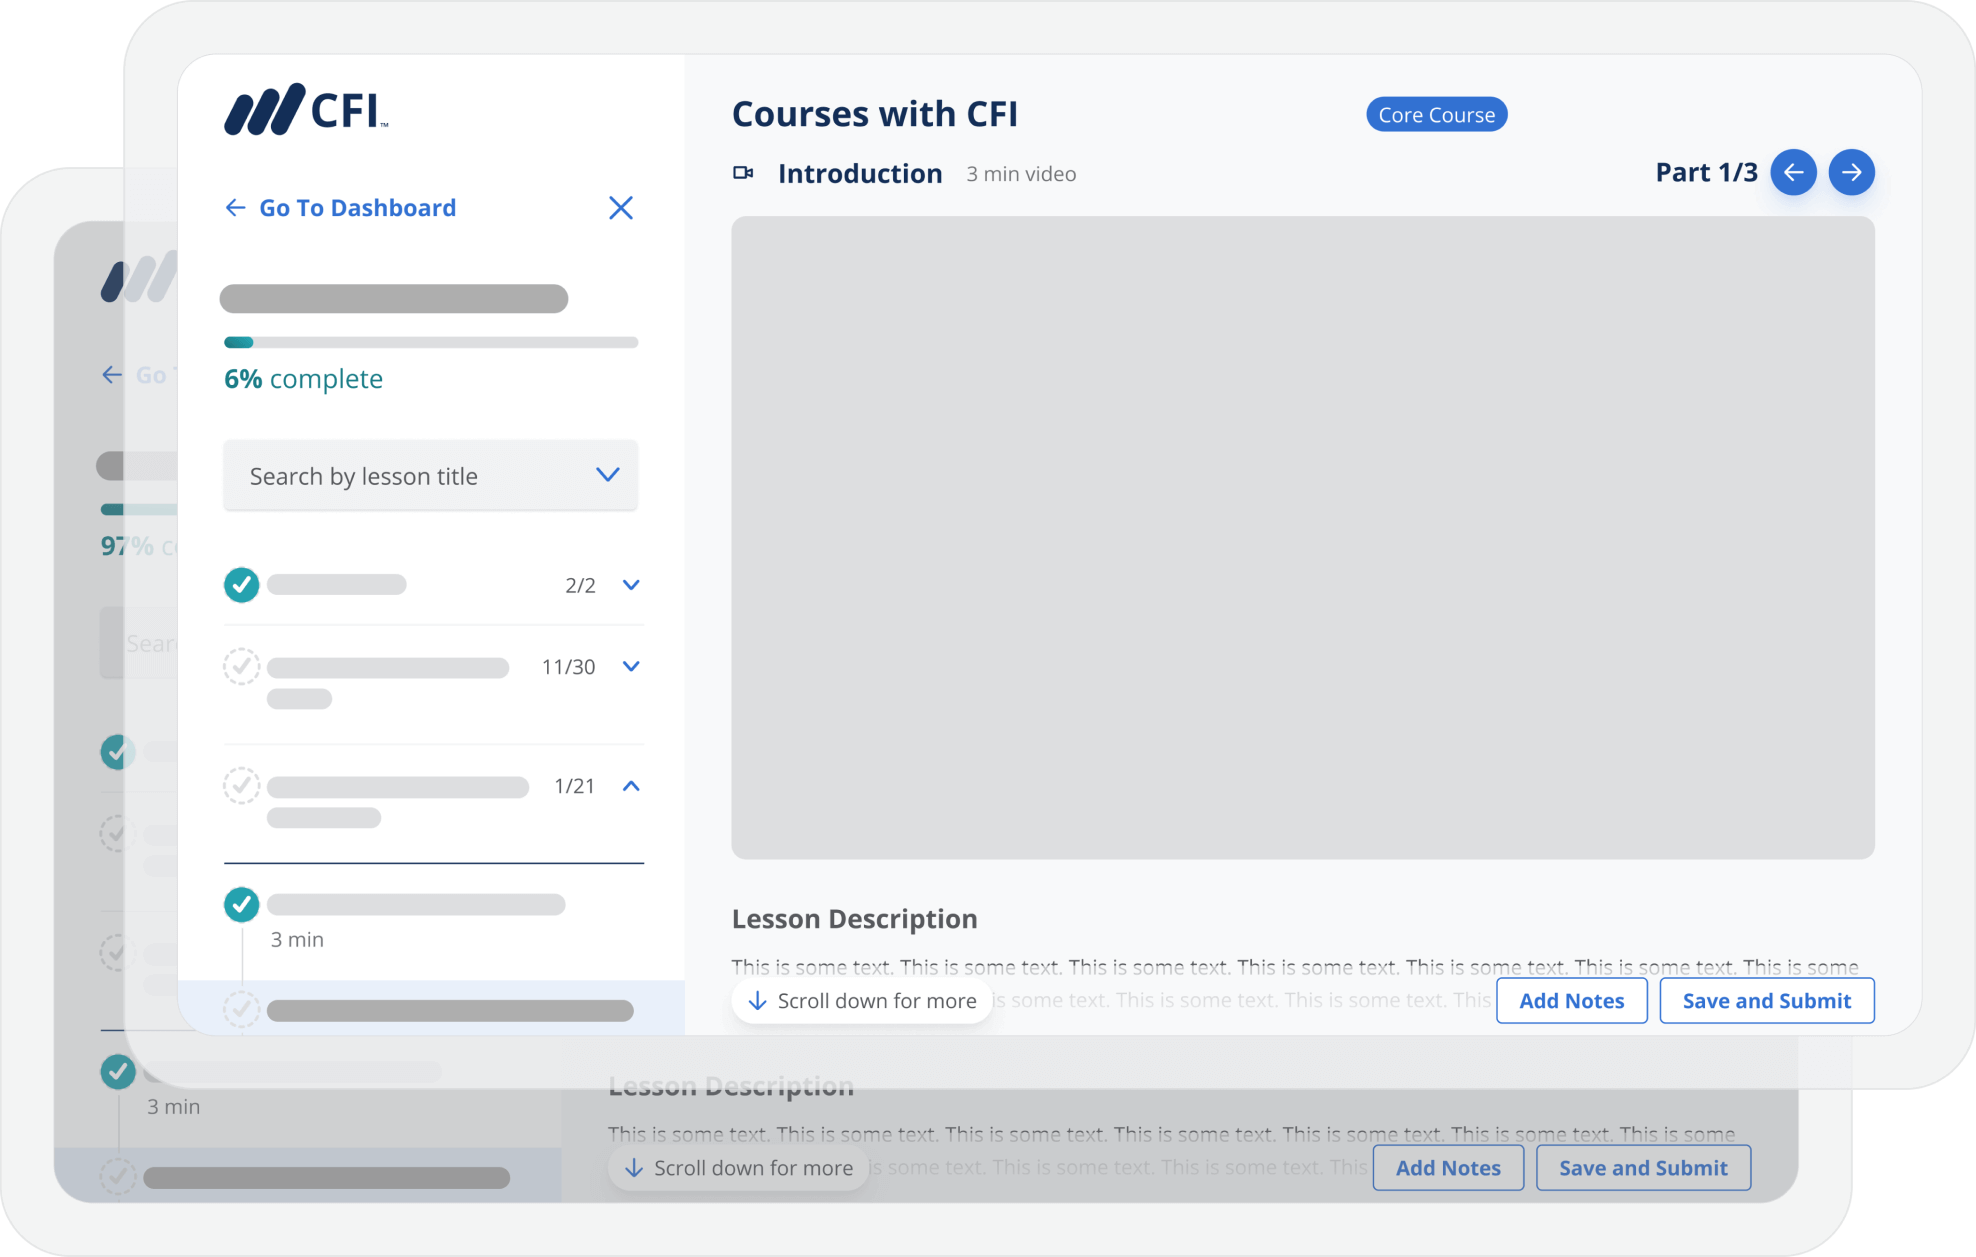
Courses include video lessons, quizzes, and final assessments.
Frequently Asked Questions

If you haven’t found your answer from our FAQ, please send us a message.
What is data visualization?

Data visualization is the process of turning raw data into visual formats such as charts, graphs, and dashboards to make information easier to understand and interpret. It helps professionals identify trends, patterns, and insights that guide smarter business decisions.

What is data visualization used for in finance?

In finance, data visualization is used to transform financial data into clear, actionable insights that support strategic decision-making. Analysts rely on visual tools to track key performance indicators (KPIs), compare forecasts, and communicate trends to stakeholders. These visual skills are essential for roles in financial planning and analysis (FP&A), corporate development, business intelligence, and strategy.

What data visualization tools should I learn?

The most widely used tools for finance and business data visualization include Power BI, Tableau, and Excel. CFI’s courses provide hands-on experience with these tools, helping you build the technical and analytical skills needed to create professional-quality dashboards and reports that tell a story with data.

How long does it take to learn data visualization online?

Most people can learn the fundamentals of data visualization within a few weeks by studying consistently and practicing with real datasets. The time it takes to gain confidence depends on your background, learning style, and how deeply you want to explore tools like Power BI, Tableau, or Excel. Many online courses and guided projects can help you build practical skills quickly, often within one to three months. 

CFI’s flexible online learning experience enables you to achieve these goals at your own pace, earning a professional certificate that showcases your skills.

How does data visualization training support career growth?

Data visualization training helps professionals move beyond spreadsheets to present insights that influence business strategy and decision-making. Employers value candidates who can communicate data clearly and persuasively. With CFI’s practical, job-focused approach, you’ll gain the technical expertise and confidence to stand out in roles such as analyst, consultant, or data-driven finance professional.

Can beginners start with CFI’s data visualization courses?

Yes. CFI’s data visualization courses are designed for learners at all levels, including those with no prior experience. The lessons are practical, self-paced, and led by industry experts who explain each concept step-by-step. You’ll build skills progressively, starting from the basics and advancing to more complex visualization techniques used in professional finance roles.

What skills do you learn in data visualization training with CFI?

CFI’s training teaches you how to clean, analyze, and visualize data using Excel, Power BI, and Tableau. You’ll learn to design professional dashboards, apply data modeling techniques, and communicate findings effectively to management and clients. These skills prepare you to deliver insights that drive performance and support data-informed business decisions.

Is a data visualization certification worth it?

Earning a data visualization certification is a smart way to build your credibility and open new career opportunities in analytics, business intelligence, and finance. These programs teach you how to transform complex data into clear, compelling insights that drive better decisions. You’ll gain valuable experience with tools like Power BI and Tableau while strengthening your ability to communicate findings effectively. 

For those ready to take the next step, CFI’s Business Intelligence & Data Analyst (BIDA®) certification provides a practical, hands-on path to mastering these skills and standing out in the job market.

If you haven’t found your answer from our FAQ, please send us a message.
0 search results for ‘