Overview
Tableau Trading Dashboard Overview
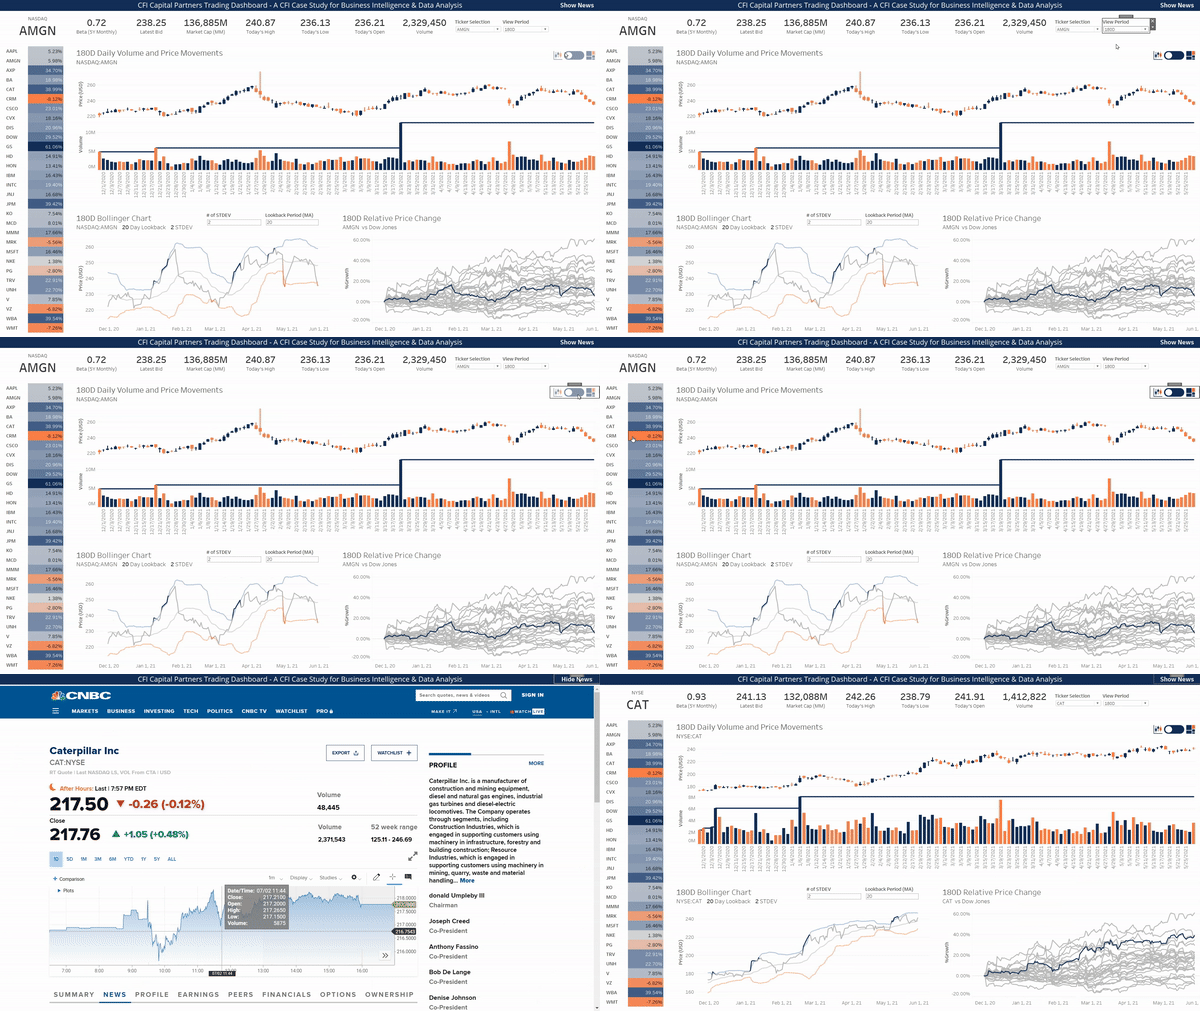
In this case study, you’ll take on the role of a Business Intelligence Analyst in an investment bank. The Sales and Trading team at CFI Capital Partners need you to develop customized dashboards to help their team with bespoke market analysis.
You will be creating candlestick charts, Bollinger bands, market cap tree maps, growth plots, and much more in this exciting real-world scenario.
With plenty of extended student challenges and interactive exercises, this course is the perfect scenario-based case study to reinforce your more advanced knowledge of Tableau, including tableau calculations, parameters, and order of operations.
If you like you’ll also have the opportunity to source your data from a company database using an SQL query, therefore combining tools as you would in the real world.
Tableau Trading Dashboard Learning Objectives
This case study is the perfect way to practice your Tableau and BI skills, and will help reinforce five key areas of Tableau:
- Creating Advanced Visuals – Candlesticks, Bollinger Bands and more
- Parameters – for filtering and highlighting
- Order of Operations – The key unlocking your Tableau superpowers
- Table Calculations – for moving averages and rolling maximums
- Parameter Actions – for next-level dashboard interactivity

Who should take this Tableau Trading Dashboard Course?
This course is perfect for anyone who would like to practice their Tableau and SQL skills in a real-world scenario. There is no better way to kick-start a career in data analysis, quantitative analysis, business intelligence, or other areas of finance than with applied, practical knowledge of Tableau and related BI tools.Prerequisite Courses
Recommended courses to complete before taking this course.
Tableau Trading Dashboard
Level 4
2h 34min
100% online and self-paced
Field of Study: Finance
Start LearningWhat you'll learn
Pull Historical Prices into Tableau
Pull Intraday Prices into Tableau
Qualified Assessment
This Course is Part of the Following Programs
Why stop here? Expand your skills and show your expertise with the professional certifications, specializations, and CPE credits you’re already on your way to earning.
Business Essentials Certificate
- Skills Learned Microsoft Excel, Word, PowerPoint, Business Communication, Data Visualization, Ethics
- Career Prep Sales Skills, People Management Skills, Relationship Management Skills, Business Analysis Skills
Business Intelligence Analyst Specialization
- Skills learned Data Transformation & Automation, Data Visualization, Coding, Data Modeling
- Career prep Data Analyst, Business Intelligence Specialist, Finance Analyst, Data Scientist


