Top 10 Data Visualization Courses for Financial Analysts

Top 10 Data Visualization Courses for Financial Analysts

In the world of finance and accounting, data can come in many forms, such as assets, liabilities, equity, income, expenses, and cash flow. Thus, to be a financial analyst, you must learn how to collect, manage, and interpret financial data.

One of the best ways to make financial data more digestible and easier to understand is to demonstrate it in data visualization. If you’re a finance or accounting professional who wants to learn data visualization, you should enroll in data visualization courses. 

What is Data Visualization?

Data visualization is the conversion of standard data into charts, graphics, and other visuals that make understanding the data easier. To learn how to be a data scientist who uses online tools to create data visualizations, financial analysts can take data visualization courses.

Basic Data Visualization Techniques

Data visualization can come in various forms or techniques. Some of the most effective and common techniques for data visualization include the following:

Graphs and Charts

It’s very common for data visualization to appear in the form of a graph or chart. This is partly due to how easily graphs and charts convey complex information. 

A bar and line graph is a perfect example of informative data visualization formats. This is because bar and line graphs easily display the movements of numerical values over time. A bar and line graph can also display how numerical values relate to one another, making it easier to analyze the correlation of multiple datasets. 

An example of a type of chart that financial analysts can use for data visualization is a pie chart. A pie chart is a great tool for data visualization because it can quickly communicate proportional values. 

Heat Maps

Heat maps are also an effective form of visualizing data. Heat maps use color gradients to visually signify changes or correlations in data. For example, warmer colors such as red or orange on a heat map can signify places with warmer temperatures while cooler colors such as shades of blue or white can signify places with colder temperatures. As described in our example, the data overlaid on heat maps often contain certain meanings such as locations or time of year. 

Box and Whisker Plots

A box and whisker plot is a graphical representation of datasets and how they’re distributed. Visually, box and whisker plots look like groupings of rectangular boxes with lines on each end. 

Box and whisker plots are a great form of data visualization because they easily display how numerically close or far apart datasets are from one another. They’re also great at displaying outliers in data and demonstrating whether or not data is skewed. Box and whisker plots even make it so that financial analysts can quickly pick out the median or quartiles within a dataset.  

Word Clouds

Word clouds are a form of visualizing data that shows various text words or phrases displayed together in a certain shape. This shape could be abstract and cloud-like or be the form of an object or creature. For example, a word cloud could be a bunch of text squished together to form the shape of a butterfly. 

Word clouds are an effective form of data visualization because they make it easy to quickly pick out which words in a dataset are used most frequently, as those words are larger in size. 

Word clouds also make deciphering the correlation between various sets of words easier. The datasets that the words in word clouds typically come from include blog posts, speeches, and databases. 

Infographics

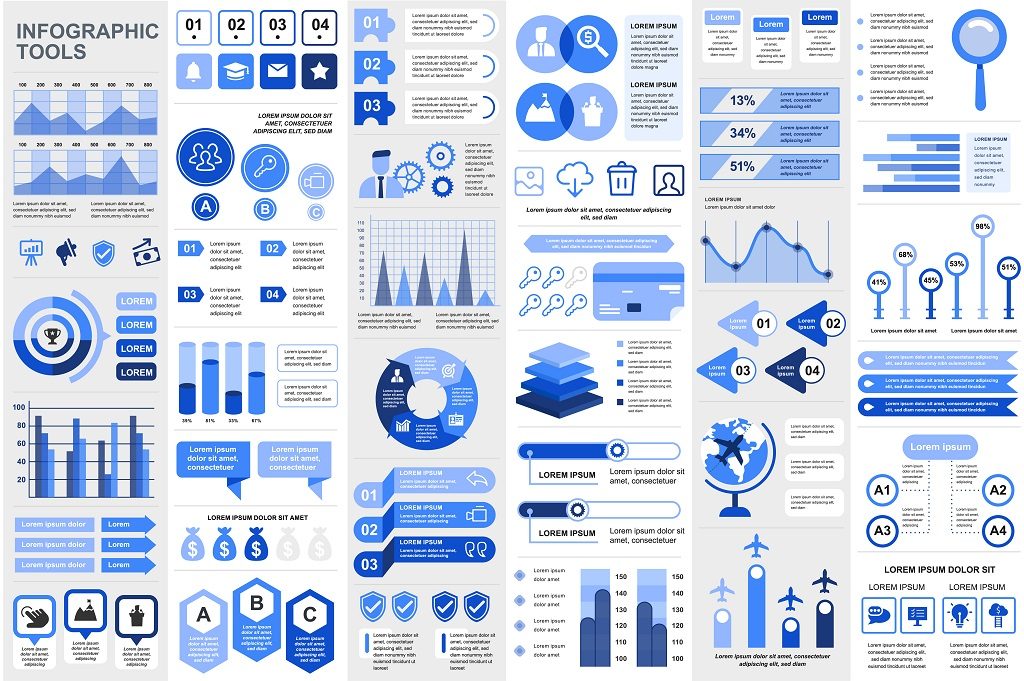
Infographics are graphic visual representations of data and information. Infographics can vary greatly in appearance, as they can take on a combination of traits from other data visualizations. Thus, the images, text, and colors in an infographic vary depending on the information that the infographic is trying to display. 

As varied as infographics can be in their appearance, they are a highly effective form of data visualization. This is because infographics have the flexibility of displaying all the visuals and details that they need to convey data and information. 

Data Visualization and Business Intelligence Tools 

Just as there are different forms of data visualization, there are also different data visualization tools. Some common data visualization and business intelligence tools include Mode, Power BI, Sigma, and the BI and analytics software Tableau. Financial analysts can use these tools to help create charts and graphs. 

Benefits of Financial Analysts Having Strong Data Visualization Skills

Data visualization courses aren’t only for financial analysts who want to learn how to visualize data for the first time. They’re also for financial analysts who already have data visualization skills but want to make their skills stronger. 

As a financial analyst, there are many benefits to having strong data visualization skills. Some of these benefits are detailed below.

Helps to Simplify Data

Data visualizations make complex financial data easy to understand. As a result, financial analysts with strong data visualization skills can use their skills to create visualizations that simplify otherwise complicated financial data. 

Saves Time

Another major benefit of financial analysts having strong data visualization skills is that it prevents them from wasting their time manually combing through financial data every time they want to conduct data analysis. This is because data visualizations allow financial analysts to quickly and easily interpret and analyze large quantities of data. 

Makes It Easier to Explain Financial Data to Clients and Stakeholders

Strong data visualization skills make it easier for financial analysts to explain financial data to clients and stakeholders. This is because data visualizations are designed for anyone, even people who know little about the subject matter that the data visualizations are about, to understand the information at hand quickly. Therefore, clients and stakeholders who know little about financial data can still understand the data’s key components and what those components imply. 

Makes Their Companies More Appealing to Stakeholders

One trait that stakeholders love to see in the companies they invest in is transparency. This is because transparency demonstrates that a company has good values and will be honest about its finances and efforts. 

When financial analysts who have strong data visualization skills put data visualizations in their company financial reports, the companies that they work for will appear more transparent to stakeholders. As a result, stakeholders will be more incentivized to invest in these companies. 

Due to how clear and digestible data visualizations are, financial analysts who use them are more likely to pick up on patterns and trends in financial data. Such knowledge then gives financial analysts the ability to create financial plans and make predictions about future company financial behavior. The ability to quickly pick up on patterns and trends in data can even help financial analysts progress in their careers.

Data Visualization Courses for Financial Analysts

As mentioned at the top of this article, there are different data visualization courses that financial analysts can take advantage of. Some examples of high-quality data visualization courses for financial analysts are detailed below.

1. Data Visualization – University of Illinois at Urbana-Champaign

Offered online through Coursera, the University of Illinois at Urbana-Champaign’s course on data visualization consists of five modules. These modules include Course Orientation, The Computer and the Human, Visualization and Numerical Data, Visualization of Non-Numerical Data, and the Visualization Dashboard. 

By going through these five modules, financial analysts will learn new data visualization concepts from experts. At the end of this course, financial analysts will even receive a shareable certificate. 

It’s important to note that this course is part of the Data Mining Specialization. Therefore, financial analysts in this course will also be enrolled in the Data Mining Specialization program. Financial analysts can currently enroll in this course for free. 

2. Overview of Data Visualization – Coursera Project Network

This free Coursera course on data visualization will teach financial analysts the concept of data visualization and its benefits. Other skills that the Coursera Project Network Overview and Data Visualization course teaches include how to visualize data with the appropriate types of charts and how to chart data in Google Sheets. 

3. Dashboards and Data Visualization – CFI

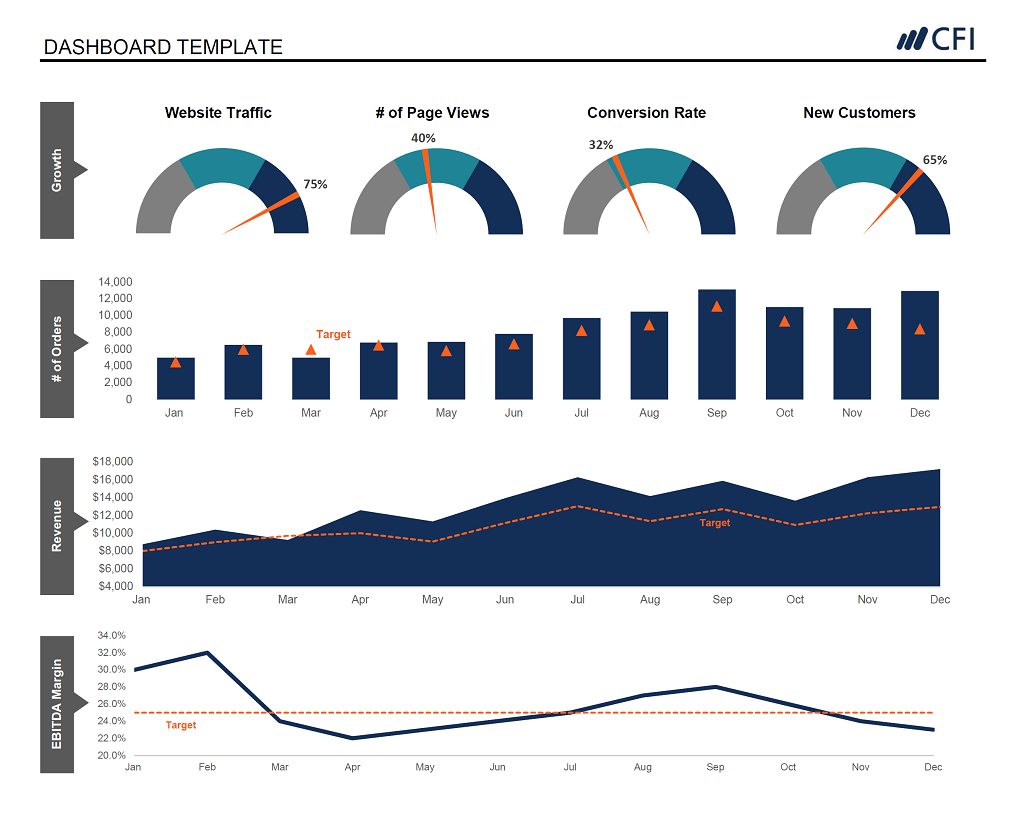
The Dashboards and Data Visualization course here at CFI can teach financial analysts how to build custom Excel data visualization dashboards and presentations filled with charts, graphs, and other visuals. It can also teach financial analysts the basics of data visualization, along with the theory and concepts that drive data visualization. 

In addition, the CFI Dashboards and Data Visualizations course can help financial analysts learn how to develop effective storytelling techniques by using the best selection, design, and presentation of charts and graphs. Before taking this course, we advise individuals to take the CFI Excel Crash Course

Dashboards and Data Visualization - CFI

4. Data Analysis and Visualization Foundations – IBM

Taught by the IBM Skills Network Team, this IBM data visualization course is currently free through Coursera. Through this IBM course, financial analysts will learn how to analyze data using Excel spreadsheets. They will also learn how to create visualizations and dashboards with Cognos’s business intelligence and performance management software. 

In addition, anyone who takes this course will learn the data ecosystem. This data analysis and visualization course is separated into four sub-courses. 

5. Data Visualization with Advanced Excel – PwC

Currently free through Coursera, this PwC course on data visualization is made up of four modules: Preparing a Professional Excel, Advanced Scenario Analysis, Data Visualization, and Dashboarding. By going through these four modules, financial analysts will learn how to use PowerPivot to build databases and data models, as well as to perform different types of scenarios and simulation analyses. 

Students who complete this course will receive a shareable certificate and will automatically be enrolled in the Data Analysis and Presentation Skills: the PwC Approach Specialization. 

6. Microsoft Excel: Data Visualization, Excel Charts, & Graphs 

Through this Microsoft Excel data visualization course on Udemy, students will master unique Excel tips, tools, and case studies. Students will also learn advanced Excel tools such as automatic dashboards, scrolling charts, and dynamic formats. 

Students will even get the opportunity to build Excel projects. This course is made up of 59 lectures across six sections. 

7. Data Science: Visualization – EdX

Offered through the Harvard University educational platform EdX, this course teaches its students the fundamentals of data visualization and data analysis. The EdX course also teaches students how to be data scientists and use the powerful package R for data visualization.

8. Learning Python for Data Analysis and Visualization Ver 1

Financial analysts who are interested in data visualization courses that will also teach them how to use the programming language Python should consider enrolling in Udemy’s Learning Python for Data Analysis and Visualization Ver 1 course. 

Through this course, financial analysts will gain an intermediate level of Python skills. With these newfound Python skills, financial analysts will learn how to analyze, visualize, and present data, along with how to use various data formats within Python. 

Through this course, financial analysts will also learn how to use the pandas module with Python to create and structure data. Financial analysts can even learn how to create data visualizations using matplotlib and the seaborn modules within Python. 

Some additional skills that financial analysts can learn include how to create and manipulate arrays and use the Jupyter Notebook Environment. In addition, anyone taking this Python-based data analysis and visualization course will leave the program with a portfolio of data analysis projects. 

9. 2024 Data Visualization in Tableau & Python (2 Courses in 1)

This updated Udemy course teaches students the principles of data visualization. It also teaches students about data preparation and manipulation along with exploratory data analysis with seaborn. 

One major benefit of enrolling in this particular course is that, regardless of your skill level, you’ll get data visualization training with both Python and Tableau, which is why this course is seen as a 2-in-1. Participants will also learn all there is to know about visual storytelling and communication. In fact, students of this 2024 course will learn how to create static visualizations with matplotlib, design interactive visualizations, and critically evaluate visualizations. 

It’s important to note that while this course caters to people with different Python and Tableau skill levels, it’s necessary to have a solid basic understanding of these programs prior to enrolling in the course. It’s also necessary that students of this course already have some knowledge of how to handle and manipulate data. Individuals who enroll in this course will receive real-life project-based learning. 

10. Data Storytelling and Data Visualization Mastery

Anyone who takes the Udemy Data Storytelling and Data Visualization Mastery course will learn how to understand and speak the language of data and how to use it to tell a story. 

They’ll also learn how to turn default data graphs from tools like Excel and Google Sheets into effective data communications. Furthermore, students of this course will learn how to create rich and informative data graphs that make an impact. 

Enroll in One of CFI’s Data Visualization Courses Today

With the wide array of quality data visualization courses in educational and online learning platforms, there’s no excuse for financial analysts not to know how to manipulate and visualize data. If you’re a financial analyst who’s looking to learn data visualization so that you can further your career and simplify your data analysis process, you should take advantage of the data visualization courses offered here at CFI. 

Because CFI is an educational institution that specializes in providing finance and investment professionals with the knowledge and skills that they need to thrive in their careers, it’s the perfect place for financial analysts to receive data visualization training that best suits their professional goals and needs. 

On top of the Dashboards and Data Visualization course mentioned in the list of top data visualization courses above, we here at CFI also offer a number of courses that will teach financial analysts how to use different business intelligence and online programming tools to visualize financial data. 

For example, we offer courses on everything from the Fundamentals of Data Analysis in Excel to Power Pivot Fundamentals, Power BI Fundamentals, Advanced Tableau LOD Calculations, and more. Explore all of the CFI data visualization courses here

Additional Resources

Top Fintech Courses and Certifications to Launch Your Career

Top 9 Excel Certifications for Finance Professionals

Top 10 Business Intelligence Courses

Top 15 Leadership Courses for Finance Professionals in 2024

See all career resources

0 search results for ‘