Get Certified for Financial Modeling (FMVA)®
Gain in-demand industry knowledge and hands-on practice that will help you stand out from the competition and become a world-class financial analyst.
Learn how to build an LBO model step by step
LBO Modeling is used to value a leveraged buyout (LBO) transaction where a target company is acquired using a significant amount of debt. The use of high leverage increases the potential returns on investors’ equity investments in the long run. An LBO model is usually built in Excel to help investors properly evaluate the transaction and realize the highest possible risk-adjusted internal rate of return (IRR).
Corporate Finance Institute® covers LBO modeling and transactions in-depth in our Leveraged Buyout (LBO) Financial Modeling Course!
The following steps are essential to building a thorough and insightful LBO model:
Before building the LBO model, assumptions must be made regarding key inputs, including financing, business operating metrics, sources and uses of cash, purchase price allocation, and operating scenarios.
Excel functions and formulas can be used to set up a drop-down list, allowing different results to be reflected in later sections (such as the DCF model) depending on the chosen scenario.
Once all the assumptions are laid out, the income statement, balance sheet, and cash flow statement are constructed and linked using historical data. Supporting schedules, such as working capital and depreciation schedules, are also built to calculate the corresponding line items on the financial statements.
Forecasting is then performed on the three financial statements based on the established assumptions.
Before completing the full forecast on the financial statements, a transaction balance sheet must be constructed to display the pro forma balance sheet items following recapitalization. The transaction balance sheet lays out the total adjustments and capital structure of the business after the LBO transaction is completed. The closing pro forma balance sheet will be reflected in the balance sheet section to inform the forecasts.
The debt and interest schedules model the details of all layers of debt and interest payments associated with the LBO transaction, including line of credit, term loans, and subordinated debt. With the debt schedules completed, the remaining linking can be done for the financial statements.
Corporate Finance Institute® covers LBO modeling and transactions in-depth in our Leveraged Buyout (LBO) Financial Modeling Course!
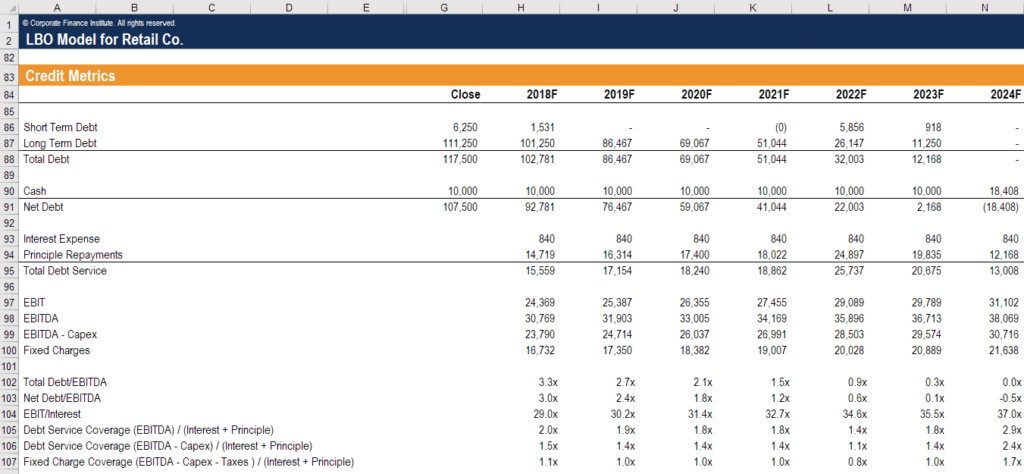
The credit metrics assess the repayment profile and examine the company’s ability to service its debt obligations, including the repayment of principal and interest. Key credit metrics in an LBO model include the debt-to-EBITDA ratio, interest coverage ratio, debt service coverage ratio, and fixed charge coverage ratio.
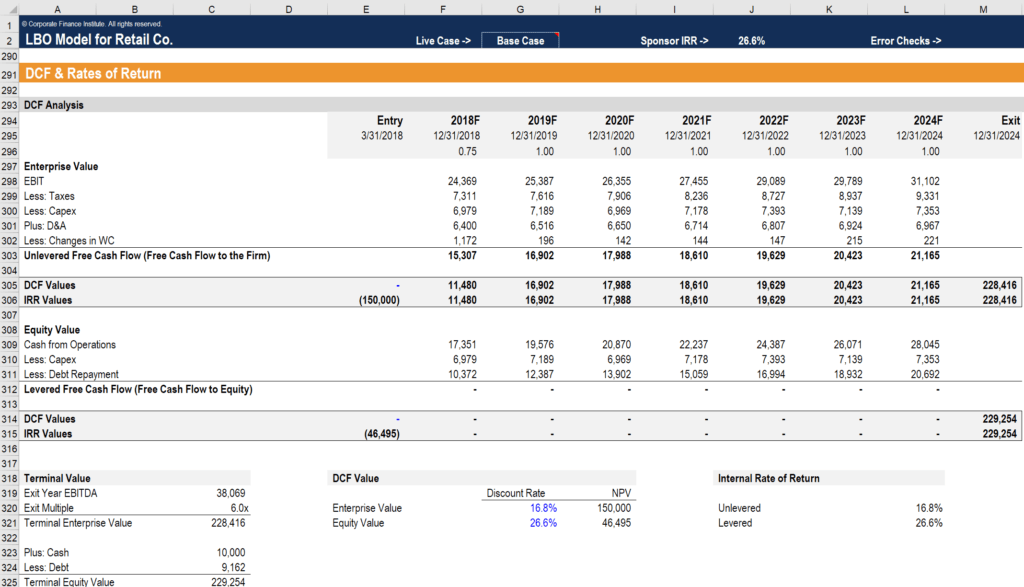
Ultimately, a DCF model is constructed using the forecasted data. The free cash flows are calculated for each investor type, which are then used to determine the internal rates of return (IRR) and net present value (NPV) by investor type.
Following the creation of the DCF model, sensitivity analysis can be performed to assess how the IRR will be affected when different independent variables change, holding all other assumptions unchanged.
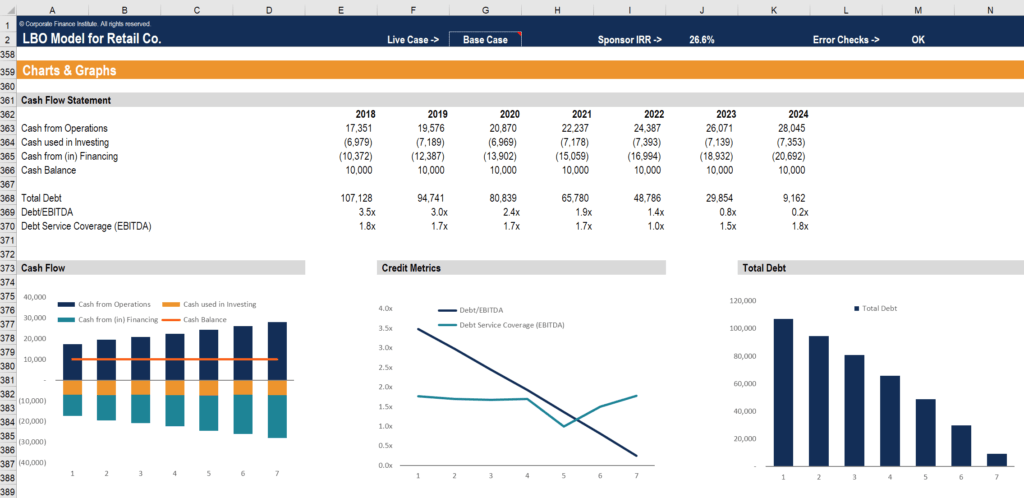
Finally, charts and graphs can be created to present the change in cash flows and the amount of leverage over time.
Thank you for reading CFI’s guide to LBO Modeling. Check out some of these resources below, including a course that can help you learn to model LBO transactions in more detail!


