Get Certified for Financial Modeling (FMVA)®
Gain in-demand industry knowledge and hands-on practice that will help you stand out from the competition and become a world-class financial analyst.
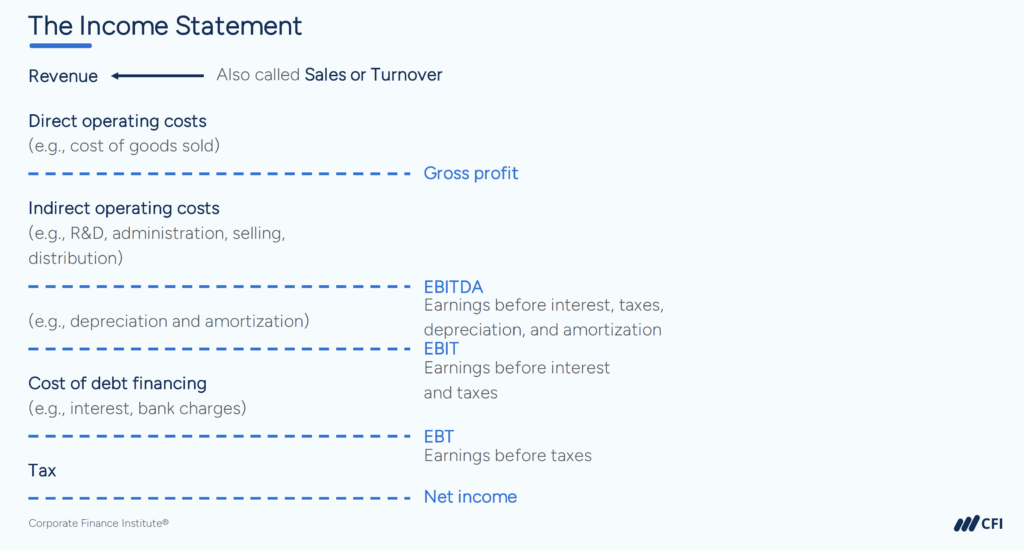
Finance professionals frequently refer to EBITDA (Earnings Before Interest, Taxes, Depreciation, and Amortization) as a proxy for cash flow, but that’s not quite the full story. While both EBITDA and cash flow are often used together in financial analysis, they measure very different things.
EBITDA is an estimate of a company’s profitability before interest, taxes, depreciation, and amortization.
At a glance, EBITDA strips out non-cash expenses (like depreciation and amortization) and excludes financing and tax decisions (interest and taxes), which can vary across companies. That makes it easier to compare different companies’ operating performances.
So, when analysts or investors want a quick view of a company’s core operating profitability, EBITDA gets the job done. Here’s why:
This stripped-down version gives a cleaner look at how much income the business might generate before obligations.
But here’s the catch: EBITDA isn’t a GAAP or IFRS-recognized metric. Companies aren’t required to report it, and there’s no universally accepted formula. That means one company’s EBITDA might not be directly comparable to another company’s unless you know exactly how it’s being calculated. It’s still widely used in finance, but it’s always worth checking the details.
You can calculate EBITDA using the income statement (unless depreciation and amortization are not shown as a line item, in which case these can be found on the cash flow statement).
Operating cash flow is a GAAP- and IFRS-compliant measure reported directly on the cash flow statement as “cash flow from operations”. Operating cash flow shows actual cash generated or spent by business operations for a specific period.
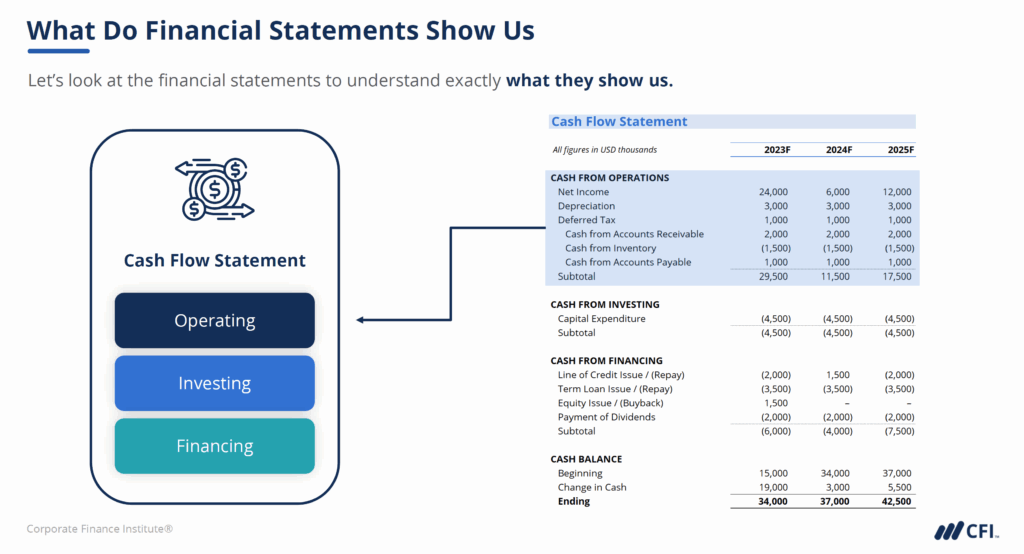
Depreciation and amortization, along with other non-cash items, are added back to cash from operations. Non-cash items include stock-based compensation, unrealized gains/losses, or write-downs.
Cash from operations also includes changes in net working capital items, such as accounts receivable, accounts payable, and inventory. However, cash from operations does not include capital expenditures (the investment required to maintain capital assets).
When finance professionals refer to EBITDA as a proxy for “cash flow,” they typically mean cash flow from operations, or operating cash flow. However, cash from operations captures vital elements, such as working capital changes, which can make it significantly different from EBITDA.
| Based on | Income statement | Cash flow statement |
| GAAP/IFRS accounting principle | ❌ No | ✅ Yes |
| Includes changes in working capital? | ❌ No | ✅ Yes |
| Includes CapEx? | ❌ No | ❌ No |
| Includes non-cash adjustments? | ✅ D&A, but potentially others | ✅ Full range (D&A, stock comp, etc.) |
| Cash-based? | ❌ No | ✅ Yes |
| Includes interest & tax expenses? | ❌ Excludes both | ✅ Usually |
| Use in corporate finance | Compare operating profit across peer companies | How much cash is generated from operations |
| Use in valuation | Enterprise value | Equity value |
The following example shows how EBITDA vs. Cash Flow can significantly differ, even though both metrics reflect a company’s operating performance.
A fictional company called FuturaTech just wrapped up a solid year, reporting the following financial results:
(All figures are in thousands)
To calculate EBITDA, we simply add back interest, taxes, and non-cash depreciation and amortization to net income:
| EBITDA Reconciliation | Amount (in $000s) |
| Net Income | 1,800 |
| + Interest Expense | 300 |
| + Income Tax Expense | 400 |
| + Depreciation & Amort. | 1,500 |
| = EBITDA | 4,000 |
That $4 million EBITDA paints a picture of healthy operational profitability. But it’s not the whole picture.
When we shift focus to operating cash flow, we get a different story. Here’s what FuturaTech’s cash flow statement shows:
| Cash Flows from Operating Activities | Amount (in $000s) |
| Net Income | 1,800 |
| + Depreciation & Amortization | 1,500 |
| – Increase in Accounts Receivable | (1,000) |
| – Increase in Inventory | (800) |
| + Increase in Accounts Payable | 600 |
| = Operating Cash Flow (OCF) | 2,100 |
Despite $4 million in EBITDA, the business only generated $2.1 million in actual cash from operations. That’s nearly half.
(in $000s) | ||
|---|---|---|
| EBITDA | Profitability before interest, taxes, and some non-cash expenses | |
| Operating Cash Flow | Actual cash from operations, including working capital changes |
EBITDA assumes clean operations, no delays in collections, no inventory buildup, and no day-to-day inefficiencies or delays in converting accounting profits into actual cash. But real businesses rarely work that way.
In FuturaTech’s case:
These working capital movements don’t affect EBITDA, but they absolutely affect cash flow.
As the FuturaTech example demonstrates, EBITDA vs. Cash Flow can vary significantly in practice. EBITDA is helpful for standardizing profitability and comparing companies, especially in financial modeling, comparable company analysis, and valuation. Operating cash flow gives you a picture of actual cash generated by a company’s operations. If you’re doing deep financial analysis or thinking like a lender or investor, operating cash flow is usually a more reliable number.
Want to build this kind of financial insight? CFI’s Financial Analysis Fundamentals course is a great next step. It’s also part of our Financial Modeling & Valuation Analyst (FMVA®) Certification, designed to equip you with the practical skills analysts need to stand out.
Ready to become a world-class financial analyst?
CFI’s FMVA® Certification teaches you to build advanced financial models in Excel, perform valuation, and deliver insights that drive decisions. Learn at your own pace through structured courses and hands-on practice — and earn an industry-recognized credential.
The Ultimate Cash Flow Guide (EBITDA, CF, FCF, FCFE, FCFF)


