Get Certified for Financial Modeling (FMVA)®
Gain in-demand industry knowledge and hands-on practice that will help you stand out from the competition and become a world-class financial analyst.
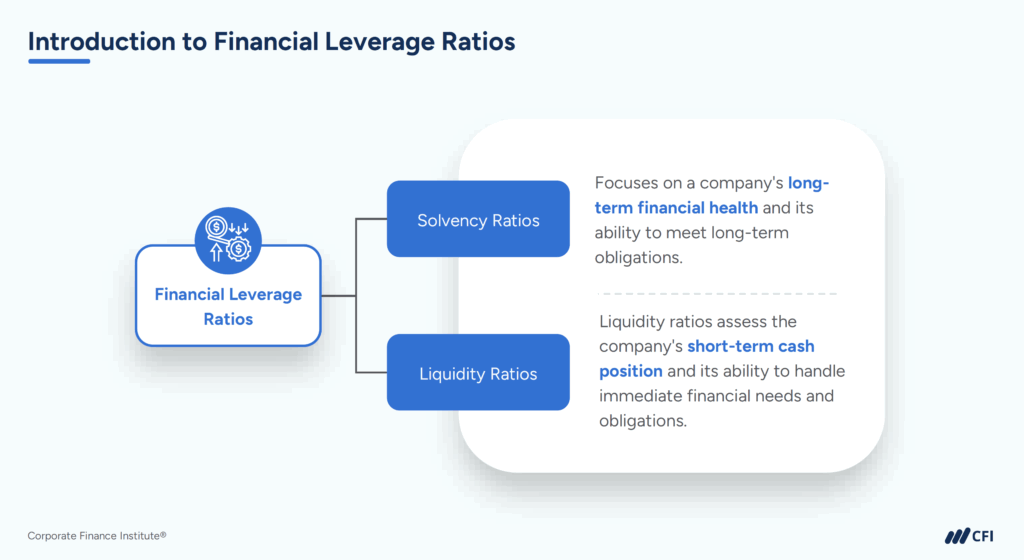
Liquidity vs. solvency comes up often in financial analysis, and for good reason — they highlight two very different questions. Can the company pay its bills this month? And can it stay in business over the long haul?
Liquidity is about having enough cash or near-cash assets to cover short-term obligations like payroll, inventory, or upcoming loan payments. Solvency, on the other hand, is about the bigger picture: whether a company’s total assets can cover all of its long-term debts and financial commitments.
Both liquidity ratios and solvency ratios are essential tools for assessing a company’s ability to meet its financial obligations in the near term and over the long run. Together, they help analysts form a clearer picture of short-term resilience and long-term financial sustainability.
Financial analysts rely on specific metrics to quantify both liquidity and solvency when evaluating a company’s financial position. These standardized ratios transform raw financial data into meaningful insights about a company’s operational stability and long-term viability.
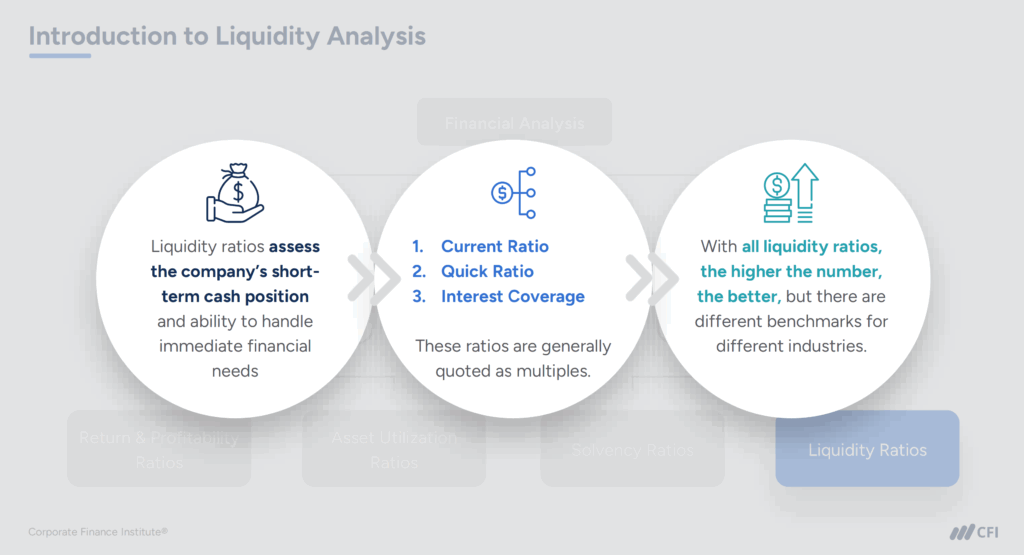
Liquidity ratios help analysts assess whether a company has enough current assets to cover its short-term obligations — in other words, whether it can pay its bills without running into cash flow trouble. These ratios are especially important in operationally intense businesses like retail or manufacturing, where working capital needs can fluctuate seasonally.
Each ratio focuses on a slightly different angle:
Here’s a quick breakdown of the most widely used liquidity ratios:
| Current Ratio | Current Assets ÷ Current Liabilities | Ability to meet short-term obligations using all current assets | 1.5–3.0 is healthy; above 3.0 may suggest inefficient asset use |
| Quick Ratio (Acid Test) | (Current Assets – Inventory) ÷ Current Liabilities | Immediate liquidity, excluding inventory | ≥1.0 generally indicates solid short-term financial strength |
| EBITDA to Interest Ratio | EBITDA ÷ Interest Expense | Company’s ability to service debt using earnings | >3.0 suggests strong coverage; <1.5 may signal risk of financial stress |
Taken together, these three liquidity ratios reveal whether a company can cover its short-term obligations without relying on future revenue or external financing. The current ratio provides a broad look at working capital sufficiency, while the quick ratio filters for the most liquid assets, offering a more conservative test of cash availability.
The EBITDA to Interest Ratio shifts the lens to earnings strength relative to debt service — a critical indicator when assessing whether short-term liquidity is sustainable under real operating conditions.
While liquidity ratios focus on a company’s ability to meet near-term obligations, solvency ratios look further ahead — measuring how well a company can manage its long-term debt load and continue operating over time. These ratios help financial analysts evaluate whether a company’s capital structure is sustainable, particularly under stress or in low-growth environments.
Solvency ratios are especially important when assessing creditworthiness, investment potential, or a company’s ability to take on additional debt. They reflect not just how much debt a company carries, but how that debt compares to its EBITDA, equity, and tangible assets.
Here’s a summary of the most commonly used solvency ratios:
| Total Assets to Equity | Total Assets ÷ Total Shareholders’ Equity | The proportion of assets financed by equity vs. debt | >5.0 suggests high leverage and increased financial risk |
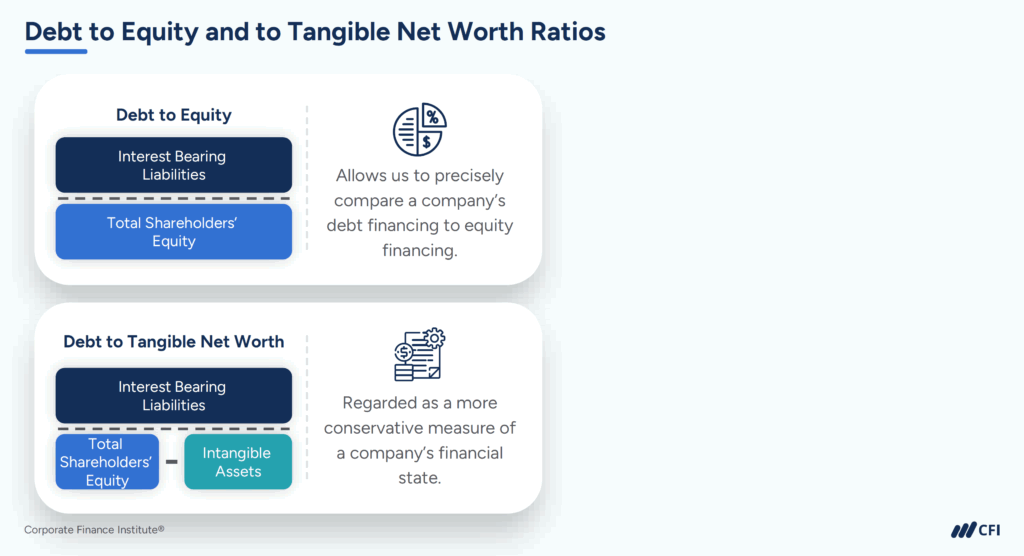
| Debt to Equity | Total Debt ÷ Total Shareholders’ Equity | Extent of reliance on debt compared to equity | >2.0 often considered high; varies by industry |
| Debt to Tangible Net Worth | Total Debt ÷ (Shareholders’ Equity – Intangible Assets) | Long-term solvency excluding non-physical assets | Lower is stronger; high ratios may indicate overreliance on intangible assets |
| Debt to EBITDA | Total Debt ÷ EBITDA | Number of years to repay debt using operating earnings | <3.0 generally healthy; >5.0 may suggest excessive debt burden |
Together, these ratios provide a clear picture of a company’s long-term financial structure. They reveal how much flexibility a company has to manage its debt obligations — and whether it’s relying too heavily on borrowed capital to fund growth.
In the context of broader financial analysis, strong solvency metrics can signal a company’s ability to weather downturns, secure favorable financing, and pursue long-term strategic goals without undue financial strain.
Let’s examine two fictional retail companies — TrendSetter Apparel and StyleMax Retail — to see how you can use liquidity and solvency ratios to reveal different aspects of financial health.
Both companies operate in the mid-size fashion retail sector with comparable annual revenues of approximately $85 million, but their financial structures tell different stories.
| Current Ratio | |||
| Quick Ratio | |||
| EBITDA to Interest |
Based on these ratios, both TrendSetter and StyleMax look financially healthy with current and quick ratios both comfortably higher than benchmarks for the retail industry.
However, both companies’ EBITDA-to-interest ratios are well below the industry benchmark. TrendSetter’s EBITDA to interest ratio (5.8) is high enough to demonstrate strong interest coverage and flexibility during retail’s seasonal shifts. StyleMax’s 2.4 ratio, while not alarming, leaves less room to absorb unexpected sales drops.
In your analysis of StyleMax, you might conclude that its debt service capability represents a material risk factor that warrants close monitoring, particularly if the retail environment deteriorates.
| Total Assets to Equity | |||
| Debt to Equity | |||
| Debt to Tangible Net Worth | |||
| Debt to EBITDA |
When you look at the solvency picture, you’ll uncover longer-term differences. TrendSetter’s lower debt-to-equity (0.8) and debt-to-EBITDA (2.3) ratios show a conservative approach to financing growth, potentially allowing for easier access to additional capital when expansion opportunities arise.
StyleMax’s higher leverage — evident in its debt-to-equity ratio of 1.9 and debt-to-EBITDA of 3.7 — isn’t necessarily problematic but does create higher fixed costs that you’ll need to monitor carefully along with its EBITDA-to-Interest ratio. You might recognize that the combination of tighter liquidity and higher leverage creates vulnerability.
As you complete your financial analysis of these companies, you might conclude that while both appear viable, TrendSetter has greater financial flexibility for weathering challenges and pursuing growth opportunities, while StyleMax requires more careful monitoring of its liquidity position and debt service obligations.
Effective financial analysis requires viewing liquidity and solvency as complementary indicators — one focused on short-term obligations, the other on long-term sustainability.
As the example of TrendSetter and StyleMax shows, companies that appear similar on the surface can differ significantly once you examine their liquidity position and debt capacity side by side. Understanding how to interpret these ratios helps you identify early warning signs, differentiate between short-term setbacks and deeper financial risk, and make sharper recommendations.
If you want to strengthen your ratio analysis skills and apply these concepts with confidence, CFI’s Financial Analysis Fundamentals course is a great next step. It’s part of the Financial Modeling & Valuation Analyst (FMVA®) Certification, which teaches you how to build advanced financial models in Excel, perform valuation, and present insightful analyses that drive business decisions.
Ready to build practical skills and earn an industry-recognized credential?


