Get Certified for Financial Modeling (FMVA)®
Gain in-demand industry knowledge and hands-on practice that will help you stand out from the competition and become a world-class financial analyst.
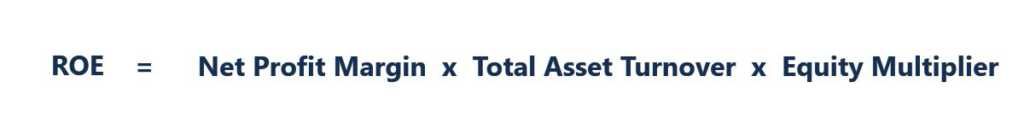
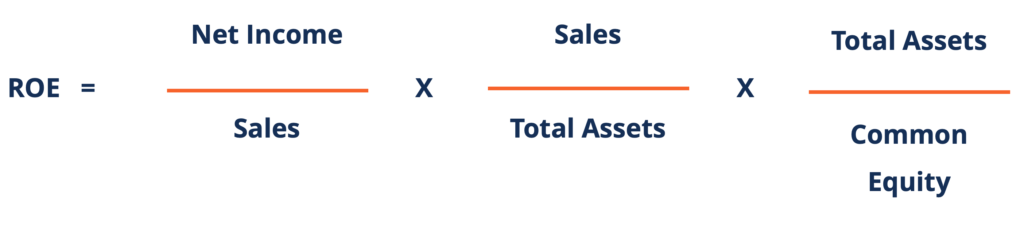
Return on Equity = Net Profit Margin x Total Asset Turnover x Equity Multiplier
In the 1920s, the management at DuPont Corporation developed a model called DuPont Analysis for a detailed assessment of the company’s profitability. DuPont Analysis is a tool that may help us to avoid misleading conclusions regarding a company’s profitability.
The analysis of a company’s profitability involves some nuances. For example, in the ROE formula, we use the book value of the company’s common equity. The said calculation method may be misleading, as we cannot be sure what caused the change in common equity. To avoid erroneous conclusions based on the ROE analysis, we can use a more in-depth analysis of this measure.
Profitability is a measure of a business’s ability to generate earnings relative to its expenses and other costs. It is one of the most important metrics for the evaluation of a business’s success.
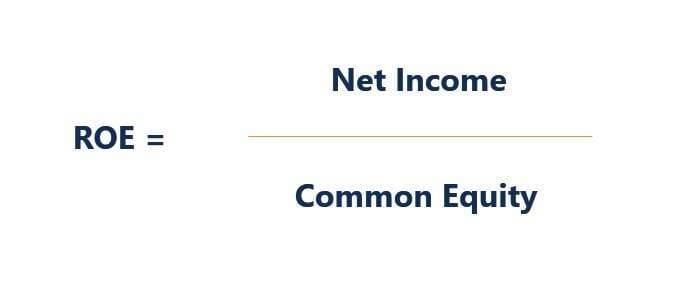
Return on Equity (ROE) is a commonly used accounting ratio that assesses a company’s profitability. It represents the amount of profit returned as a percentage of the amount of money the shareholders invested. The ROE is calculated by:
ROE may provide useful insights about the company’s performance, as we can easily define the benchmark for this measure. For example, if you are an investor looking for new investment opportunities, you can easily compare the ROE of different companies and choose the one with the highest metric, as it promises to return you the biggest profit for the amount of money invested.
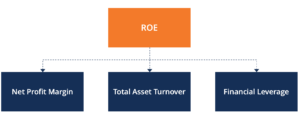
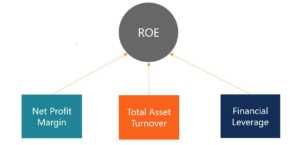
The basic DuPont Analysis model is a method for breaking down the original ROE equation into three components: operating efficiency, asset efficiency, and leverage. Operating efficiency is measured by Net Profit Margin and indicates the amount of net income generated per dollar of sales.
Asset efficiency is measured by the Total Asset Turnover and represents the sales amount generated per dollar of assets. Finally, financial leverage is determined by the Equity Multiplier.
The equation for the basic DuPont model is as follows:
We can also represent the components as ratios:
The first two components assess the operations of the business. The larger these components, the more productive the business is. However, it is worth mentioning that, depending on the industry in which the company operates, Net Profit Margin and Total Asset Turnover tend to trade off with each other. For example, a machinery manufacturer is likely to generate a low turnover of assets and require some heavy investments; thus, this company will probably see a high profit margin to offset the low turnover.
On the other hand, a fast-food restaurant is likely to see high asset turnover but a much smaller profit margin due to the lower prices. The last component, financial leverage, captures the company’s financial activities. The more leverage the company takes, the higher the risk of default.
Nevertheless, even if the company operates in the world in which there is no probability of default, additional leverage still results in a negative effect on ROE. Additional leverage means that the company needs to pay more interest, which lowers the net income. Subsequently, the company sees a lower Net Profit Margin.
The basic DuPont Analysis model does not isolate the operating activities from the financing activities. It was obvious from our observation regarding the relationship between leverage and profit margin.
A five-step DuPont model helps to solve this problem. In the model, in order to isolate operations and financial impacts on ROE, we will further break down the components used in the basic model. First of all, break down the Net Profit Margin by:
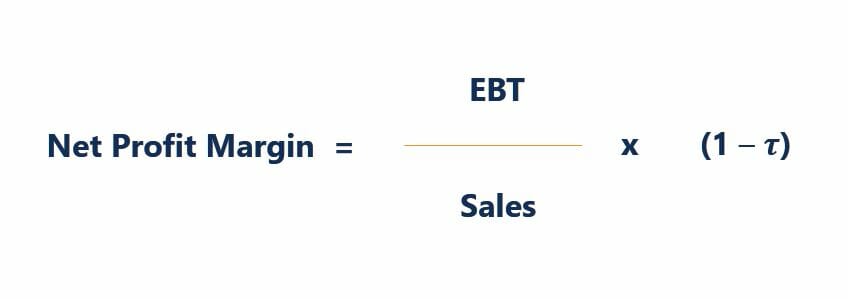
Afterward, we can isolate the effect of the interest expense on Net Profit Margin:
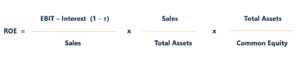
After rearranging the components in the formula, we will get:
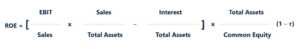
In the above model, we managed to separate the effect of interest expense on the Net Profit Margin. Thus, if the company increases its leverage, we will be able to see whether this action will influence its net income or boost its ROE. Obviously, the model provides a more in-depth analysis of the drivers behind the ROE changes.
DuPont analysis is one of many metrics used to evaluate companies.
Connect what you just learned to a clear career path with CFI’s role‑based courses and certification programs.
Thank you for reading CFI’s guide to DuPont Analysis. To learn more and advance your career, see the following CFI resources:


